我对 chartJS 有疑问。我无法在图表、yAxis 单位标题和带有元素的 yAxis labelString 周围添加边框。我正在使用与 typescript 的 react 。我只能将字符串添加到 labelString。您可以在屏幕上看到我想做的事情,在另一个屏幕上您可以看到我实际拥有的东西。
chart.js@2.7.1 中有添加这些元素的选项吗?
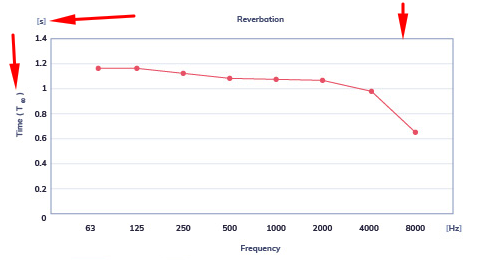

第一张图片是我的目标。二是实际。 @编辑 这是我的图表选项文件。我只是在函数中传递参数来获取这些选项。
import * as Chart from 'chart.js';

const getOptions = (
    beginAtZero: boolean,
    tickMax: number,
    tickStepValue: number,
    titleText: string,
    xAxesLabelString: string,
    yAxesLabelString: string,

): Chart.ChartOptions => {
    const ticks: Chart.LinearTickOptions =  {
        beginAtZero,
        fontColor: '#3C3750',
        fontFamily: 'Muli',
        fontSize: 10,
        fontStyle: 'bold',
        max: tickMax,
        stepSize: tickStepValue,
    };
    const options: Chart.ChartOptions = {
        legend: {
            display: false,
        },
        maintainAspectRatio: false,
        responsive: true,
        scales: {
            xAxes: [{
                display: true,
                gridLines: {
                    display: false,
                },
                scaleLabel: {
                    display: true,
                    fontColor: '#3C3750',
                    fontFamily: 'Muli',
                    fontSize: 10,
                    fontStyle: 'bold',
                    labelString: xAxesLabelString,
                },
                ticks,
            }],
            yAxes: [{
                display: true,
                gridLines: {
                    drawBorder: true,
                    tickMarkLength: 15,
                },
                scaleLabel: {
                    display: true,
                    fontColor: '#3C3750',
                    fontFamily: 'Muli',
                    fontSize: 10,
                    fontStyle: 'bold',
                    labelString: yAxesLabelString,
                },
                ticks,
            }],
        },
        title: {
            display: true,
            text: titleText,
        },
        tooltips: {
            backgroundColor: '#E4677B',
            callbacks: {
                label: (tooltipItem, data) => {
                    return 'Time: ' + data.datasets[0].data[tooltipItem.index];
                },
                title: (tooltipItem, data) => {
                    return '';
                },
            },
            custom: (tooltip) => {
                if (!tooltip) {
                    return;
                }
                // disable displaying the color box;
                tooltip.displayColors = false;
              },
        },
    };

    return {
        ...options,
    };
};

export default getOptions;
public createChart({room, roomState, chartOptions, chartDataset, chartLabels}: ILineChartProps) {
const ctx = this.canvas.getContext('2d');
this.myChart = new Chart(ctx, {
data: {
datasets: chartDataset,
labels: chartLabels,
},
options: chartOptions,
type: 'line',
});
}最佳答案
在顶部添加一个 xAxes 并在右侧添加一个 yAxes 两者都不显示就可以完成这项工作。
scales: {
        xAxes: [{
            /* Your xAxes options here */
        }, {
            position: 'top',
            ticks: {
                display: false
            },
            gridLines: {
                display: false,
                drawTicks: false
            }
        }],
        yAxes: [{
            /* Your yAxes options here */
        }, {
            position: 'right',
            ticks: {
                display: false
            },
            gridLines: {
                display: false,
                drawTicks: false
            }
        }]
    }
关于javascript - Chart.js 在折线图和 yAxis 单位标题周围添加边框 ([s]),我们在Stack Overflow上找到一个类似的问题: https://stackoverflow.com/questions/48281600/