我有一个数据集,第一列是日期,第二列是价格。 日期为交易日。

我想返回一个如下所示的表格:
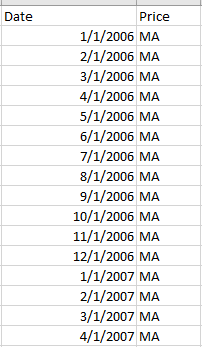
如果日期是从 2006 年开始的每个月,价格 MA 是过去 N 个月的平均价格。(N = [1,2,3,4,5,6])
例如:如果我想在 2006 年 1 月 1 日 N = 1 马应该是去年12月份的均价 如果 N = 2 Ma应该是去年11月和12月的均价
我已经阅读了一些关于从 datetime 和 groupby 中提取月份的解决方案。 但不知道如何将它们放在一起。
最佳答案
或者你只是尝试
df.sort_index(ascending=False).rolling(5).mean().sort_index(ascending=True)
关于你的附加问题
index=pd.date_range(start="4th of July 2017",periods=30,freq="D")
df=pd.DataFrame(np.random.randint(0,100,30),index=index)
df['Month']=df.index
df.Month=df.Month.astype(str).str[0:7]
df.groupby('Month')[0].mean()


Out[162]:
Month
2017-07    47.178571
2017-08    56.000000
Name: 0, dtype: float64
编辑 3:对于滚动两个月平均值的缺失值
index=pd.date_range(start="4th of July 2017",periods=300,freq="D")
df=pd.DataFrame(np.random.randint(0,100,300),index=index)
df['Month']=df.index
df.Month=df.Month.astype(str).str[0:7]
df=df.groupby('Month')[0].agg({'sum':'sum','count':'count'})
df['sum'].rolling(2).sum()/df['count'].rolling(2).sum()


Out[200]:
Month
2017-07          NaN
2017-08    43.932203
2017-09    45.295082
2017-10    46.967213
2017-11    46.327869
2017-12    49.081967
#etc
关于python - 如何在 Pandas 中获取过去几个月的移动平均值,我们在Stack Overflow上找到一个类似的问题: https://stackoverflow.com/questions/45825993/