我必须承认,了解如何创建或操作 matplotlib 的颜色图并不是一件容易的事。因此,我正在寻求一些帮助来解释和设置从蓝色(负)到红色(正)并且白色紧紧围绕零居中的颜色图。然后我想在 contourf 中使用这个 cmap:
这可行,但颜色颠倒了
cs = plt.contourf(longrid, latgrid,
                  ar[window-1]-bkgrd, levels,
                  cmap = cm.get_cmap('BuRd', len(levels)-1))
这里的问题是
BuRd_r带走了零附近的白色cs = plt.contourf(longrid, latgrid, ar[window-1]-bkgrd, levels, cmap = cm.get_cmap('BuRd_r', len(levels)-1))
我将不胜感激。
这是测试颜色图的函数和数据:
def PlotAnomalyCF(ar,hgrid,latgrid,longrid,outfile,levels,units):
    window = 1
    tsize = 8
    plt.close()
    plt.figure(figsize=(11.7,4.3) )
    plt.clf()
    plt.cla()

    bkgrd = bn.nanmean(ar[:],0)

    for v in hgrid:OA
        plt.subplot(1,len(hgrid),window)
        plt.title(v,fontsize=tsize)
        plt.subplots_adjust(left=0.07,bottom=0.75,
                            right=0.98, top=0.92,
                            wspace=0.12,hspace=0.98)
        cs = plt.contourf(longrid,latgrid,
                          ar[window-1]-bkgrd,levels,
                          cmap=cm.get_cmap('BuRd_r',len(levels)-1))
        cs.cmap.set_over('r')
        plt.grid(True)
        plt.axis('off')
        window += 1
    ax = plt.gca()
    pos = ax.get_position()
    l,b,w,h = pos.bounds
    print l,b,w,h
    cax = plt.axes([l-0.848,b-0.05,0.91,0.02]) # setup colorbar axes
    cbar = plt.colorbar(cs,cax=cax,orientation='horizontal')
    cl = plt.getp(cbar.ax, 'xticklabels')
    plt.setp(cl, fontsize=8)
    # Add units text
    plt.figtext(0.012,0.83,units,fontsize=tsize+1)
    print 'outfile.',outfile
    plt.savefig(outfile,dpi=900,orientation='landscape',format='pdf')
    plt.show()

# Data
hgrid = array([-18, -15, -12,  -9,  -6,  -3,   0,   3,   6,   9,  12,  15,  18])
latgrid = array([ 5.61402391,  4.91227095,  4.21051798,  3.508765  ,  2.80701201,
                  2.10525902,  1.40350602,  0.70175301,  0.        , -0.70175302,
                 -1.40350604, -2.10525907, -2.8070121 , -3.50876514, -4.21051818,
                 -4.91227122, -5.61402427])
longrid = array([-5.625   , -4.921875, -4.21875 , -3.515625, -2.8125  , -2.109375,
                 -1.40625 , -0.703125,  0.      ,  0.703125,  1.40625 ,  2.109375,
                 2.8125  ,  3.515625,  4.21875 ,  4.921875,  5.625   ])
levels = array([-20, -19, -18, -17, -16, -15, -14, -13, -12, -11, -10,  -9,  -8,
                -7,  -6,  -5,  -4,  -3,  -2,  -1,   0,   1,   2,   3,   4,   5,
                 6,   7,   8,   9,  10,  11,  12,  13,  14,  15,  16,  17,  18,
                 19,  20])
units ='$\mathrm{CC_{200}\,[\%]}$'
ar = shape is (13, 17, 17) with max = 82.4 and min = 45.5. It would be easier to just
     generate some random data within these intervals. Alternatively just copy one of the
     array:
ar[1] = array([[ 46.91224792,  46.21374984,  46.86130719,  47.01021234,
     46.72626813,  46.2288305 ,  46.43835451,  45.79325437,
     45.58271668,  46.35872217,  48.08725987,  48.44553638,
     47.76519316,  47.6366742 ,  48.40425078,  48.77756577,
     49.33566712],
   [ 46.83599932,  46.84286989,  47.33453309,  46.55030976,
     46.80566458,  46.53292035,  47.02261763,  47.41084421,
     47.38724565,  47.91122826,  49.21117552,  49.45223641,
     49.97629913,  50.44165439,  51.08080398,  50.79600723,  49.968034  ],
   [ 47.42288313,  47.07674124,  46.7167639 ,  46.11959218,
     46.95814111,  46.88763807,  47.79510368,  48.50213272,
     49.14340301,  50.0550682 ,  50.96554707,  51.70960776,
     52.76304827,  53.13428506,  53.01955687,  52.57951586,
     51.91245273],
   [ 47.71067291,  47.48154219,  47.40131211,  47.45929857,
     48.46118424,  48.65199823,  49.38156691,  49.86137507,
     50.55394084,  51.96604309,  52.60579898,  53.69096203,
     54.22750101,  54.37757099,  54.31517398,  53.47697773,
     53.41809044],
   [ 48.20779565,  48.58856851,  48.75880829,  49.40822878,
     50.03355014,  51.44922083,  52.00567831,  52.99485667,
     53.69339127,  53.58208129,  53.88588998,  55.24096208,
     55.24137628,  55.38338399,  55.30856415,  55.0329081 ,
     54.58041914],
   [ 49.20063728,  49.81223264,  50.2145489 ,  50.54749112,
     51.44252761,  53.1708726 ,  54.48141824,  55.1337493 ,
     55.86338227,  55.80719304,  56.1060897 ,  56.15050406,
     56.10404113,  56.82550383,  57.12370494,  56.79250814,
     57.21656741],
   [ 50.17222332,  50.78494993,  51.47036476,  51.78513471,
     54.07329312,  55.12136894,  56.63202678,  56.77587861,
     57.60688855,  57.31874243,  57.86532727,  58.38753463,
     58.52204736,  58.8451274 ,  59.17282185,  58.93137673,
     58.90977463],
   [ 51.50642331,  51.51055372,  52.44746806,  53.37696513,
     54.86775802,  56.68992167,  57.90624404,  58.76394172,
     59.64662899,  59.80540837,  59.98355254,  60.05761821,
     59.95848562,  60.54540623,  60.4776266 ,  60.11749116,
     59.74209418],
   [ 51.40396463,  51.48043239,  52.89530187,  53.73500868,
     55.39612502,  56.70178532,  58.07064267,  59.56644298,
     60.47288049,  60.59095081,  61.26474813,  61.20278944,
     61.43807574,  61.1942828 ,  60.40014922,  59.78371327,
     59.50410992],
   [ 51.89656984,  52.18725649,  52.57764233,  54.39502415,
     55.61672911,  57.04180061,  58.54357871,  59.76354498,
     60.24155861,  60.59473182,  60.65985503,  60.92762915,
     60.76726905,  60.47166256,  60.42044548,  60.04043031,
     60.06031171],
   [ 51.69698671,  52.39494994,  52.71685017,  53.65488505,
     54.52480831,  56.33091376,  57.87811829,  58.36719736,
     59.31479758,  59.61329074,  59.81807224,  59.44053305,
     59.25522337,  59.5309563 ,  59.68850776,  59.54046914,
     58.60604327],
   [ 50.81523448,  51.5690217 ,  51.81382216,  52.88514118,
     53.27394887,  54.6941369 ,  55.81938471,  56.85401174,
     57.10874072,  58.55074569,  58.45869901,  57.67496274,
     57.3895956 ,  58.05319653,  58.83009123,  57.90678384,
     56.97717781],
   [ 49.61355365,  49.92298625,  50.56281781,  51.22117266,
     51.98020374,  53.0328832 ,  53.76602714,  54.94396421,
     55.16849545,  55.83033544,  56.19720112,  56.9382048 ,
     57.20669361,  56.76351885,  56.93632305,  56.16428665,  54.7570241 ],
   [ 49.17250426,  49.14663096,  49.86504335,  50.24394193,
     50.84671744,  51.21785439,  51.72667942,  52.8287256 ,
     53.65550669,  53.81801262,  54.62490542,  54.88045696,
     55.27367041,  54.89234901,  54.51005786,  53.57284022,
     52.53966996],
   [ 48.55125023,  48.99467099,  49.80237362,  49.67943854,
     49.45569362,  49.3387854 ,  50.129718  ,  49.94784906,
     51.03357894,  51.73021167,  52.0211617 ,  52.55805334,
     52.22956095,  51.88844202,  50.87410618,  50.39506101,
     49.72117909],
   [ 48.37551433,  48.30812683,  48.45300884,  48.50818535,
     47.76798967,  47.21965588,  47.60764424,  48.21327283,
     48.52370448,  49.95221655,  49.7608777 ,  50.1178807 ,
     50.15020093,  49.4369175 ,  49.16839811,  49.31254753,
     48.03208233],
   [ 46.91675497,  46.45280928,  46.37122283,  46.69881125,
     45.95493853,  46.33296801,  46.15091804,  46.09862998,
     46.31676066,  46.6199912 ,  47.60040926,  48.34096053,
     47.78005438,  48.0951173 ,  48.15291404,  47.21140107,
     46.28884057]])
最佳答案
我不会使用常用的 cmap,而是会详细介绍您自己的制作过程。
正如您已经发现的那样,为了在使用 cmap 时绝对控制颜色(无需传递颜色数组),cmap 中的颜色数应等于级别数 - 1。
我们可以通过以下示例轻松证明这一点。让我们用以下三种原色制作一个颜色图:
import matplotlib.pyplot as plt
import matplotlib.colors as mcolors
import numpy


data = numpy.arange(12).reshape(3, 4)

cmap = mcolors.ListedColormap([(0, 0, 1),
                               (0, 1, 0),
                               (1, 0, 0)])
但是,当我们将其用于 3+1 级别以外的任何其他内容时,我们会得到您可能意想不到的结果:
plt.subplot(121)
plt.contourf(data, cmap=cmap, levels=[1, 4, 8, 10])

plt.subplot(122)
plt.contourf(data, cmap=cmap, levels=[1, 4, 8])

plt.show()
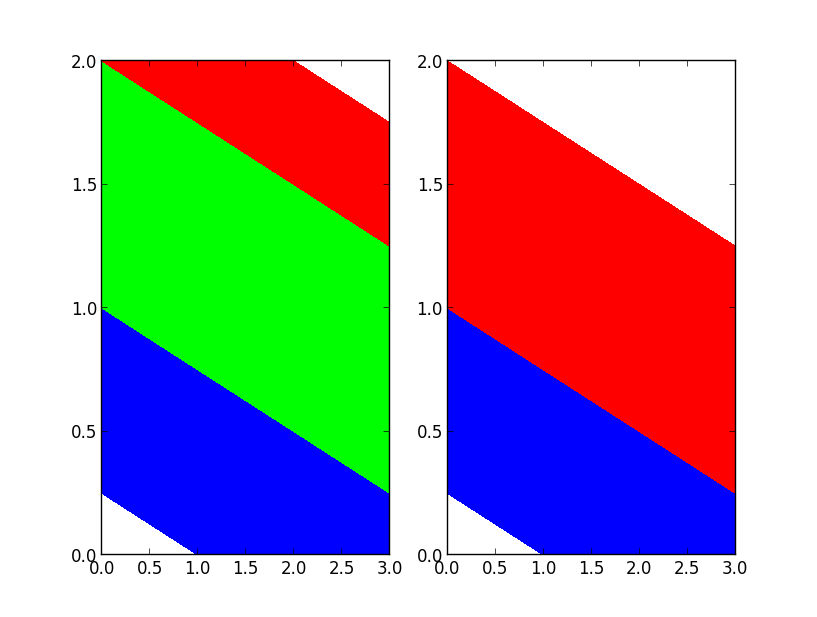
所以我已经证明你的层次必须是长度 n_colors-1,但是因为我们想要有 3 种颜色,并且总是显示中间的颜色,所以我们也必须有偶数个层次.
很好,现在我们有了一些基本规则,让我们制作一个 LinearSegmentedColormap,它本质上只是一个对 N 种颜色进行插值的 ListedColormap:
levs = range(12)
assert len(levs) % 2 == 0, 'N levels must be even.'

cmap = mcolors.LinearSegmentedColormap.from_list(name='red_white_blue',
                                                 colors =[(0, 0, 1),
                                                          (1, 1., 1),
                                                          (1, 0, 0)],
                                                 N=len(levs)-1,
                                                 )
plt.contourf(data, cmap=cmap, levels=levs)
plt.show()
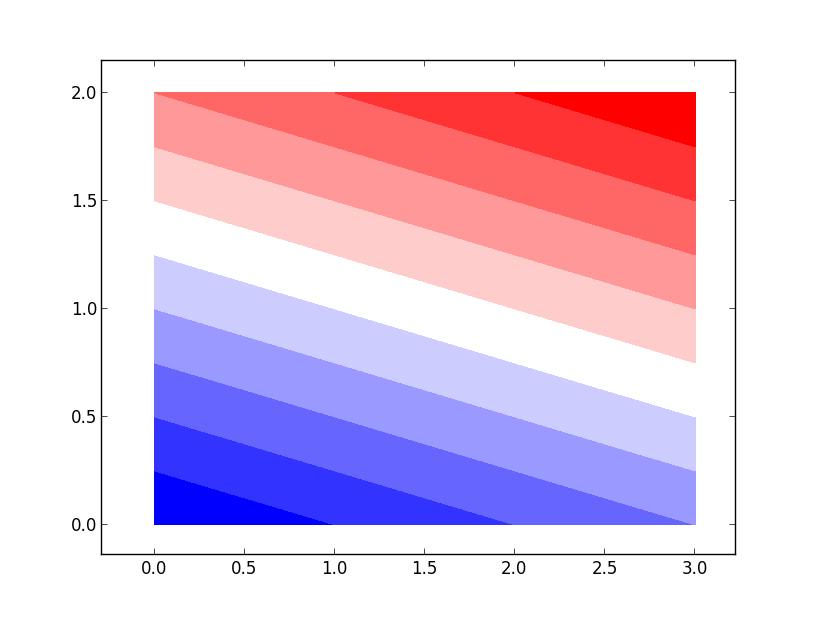
我们可以验证 normailzed cmap 以编程方式将白色作为中间色:
>>> print cmap(0.5)
(1.0, 1.0, 1.0, 1.0)
希望这会为您提供制作您喜欢的任何颜色图并在等高线绘制中成功使用它所需的所有信息。
关于python - 创建一个以零为中心的白色颜色图,我们在Stack Overflow上找到一个类似的问题: https://stackoverflow.com/questions/11647261/