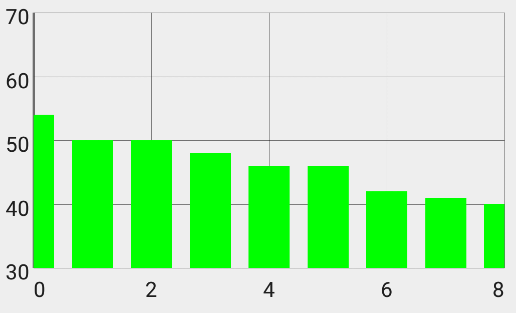
请参见下图,试图弄清楚为什么它们会跳过“1”、“3”等。
我在哪里设置系列和图表:
DataPoint[] dataPoints = new DataPoint[rankList.size()]; // declare an array of DataPoint objects with the same size as your list

        for (int i = 0; i < rankList.size(); i++) {

            dataPoints[i] = new DataPoint(i, Double.parseDouble(rankList.get(i))); // not sure but I think the second argument should be of type double
        }

        BarGraphSeries<DataPoint> series2 = new BarGraphSeries<DataPoint>(dataPoints); // This one should be obvious right? :)

        series2.setAnimated(true);
        series2.setTitle("Random Curve 1");
        series2.setColor(Color.GREEN);

        series2.setSpacing(30);

        series2.setDataWidth(1);

        graph2.getViewport().setMinX(-1);
        graph2.getViewport().setMaxX(12);

        graph2.addSeries(series2);
正在绘制正确的信息,但我已经尝试了文档中的大量内容并让它发挥作用。
最佳答案
对不起,我误解了你的问题......
这将有助于:
yourGraph.getGridLabelRenderer().setNumHorizontalLabels(numberOfBars);
关于android - Graphview 未显示所有 x 轴值,我们在Stack Overflow上找到一个类似的问题: https://stackoverflow.com/questions/40891129/