我需要在同一张图上绘制多组数据,我使用 matplotlib。
对于某些绘图,我使用 plt.plot(),对于其他绘图,我使用 plt.errorbar()。但是当我制作图例时,无论我以何种顺序将它们放入文件中,使用 plt.plot() 创建的图例首先出现(并且 zorder 似乎没有对图例中位置的影响)。
无论我如何绘制数据,如何在图例中给出我想要的顺序?
最佳答案
您可以手动调整顺序,方法是使用 ax.get_legend_handles_labels 获取图例句柄和标签,然后对生成的列表重新排序,并将它们提供给 ax.legend .像这样:
import matplotlib.pyplot as plt
import numpy as np
fig,ax = plt.subplots(1)
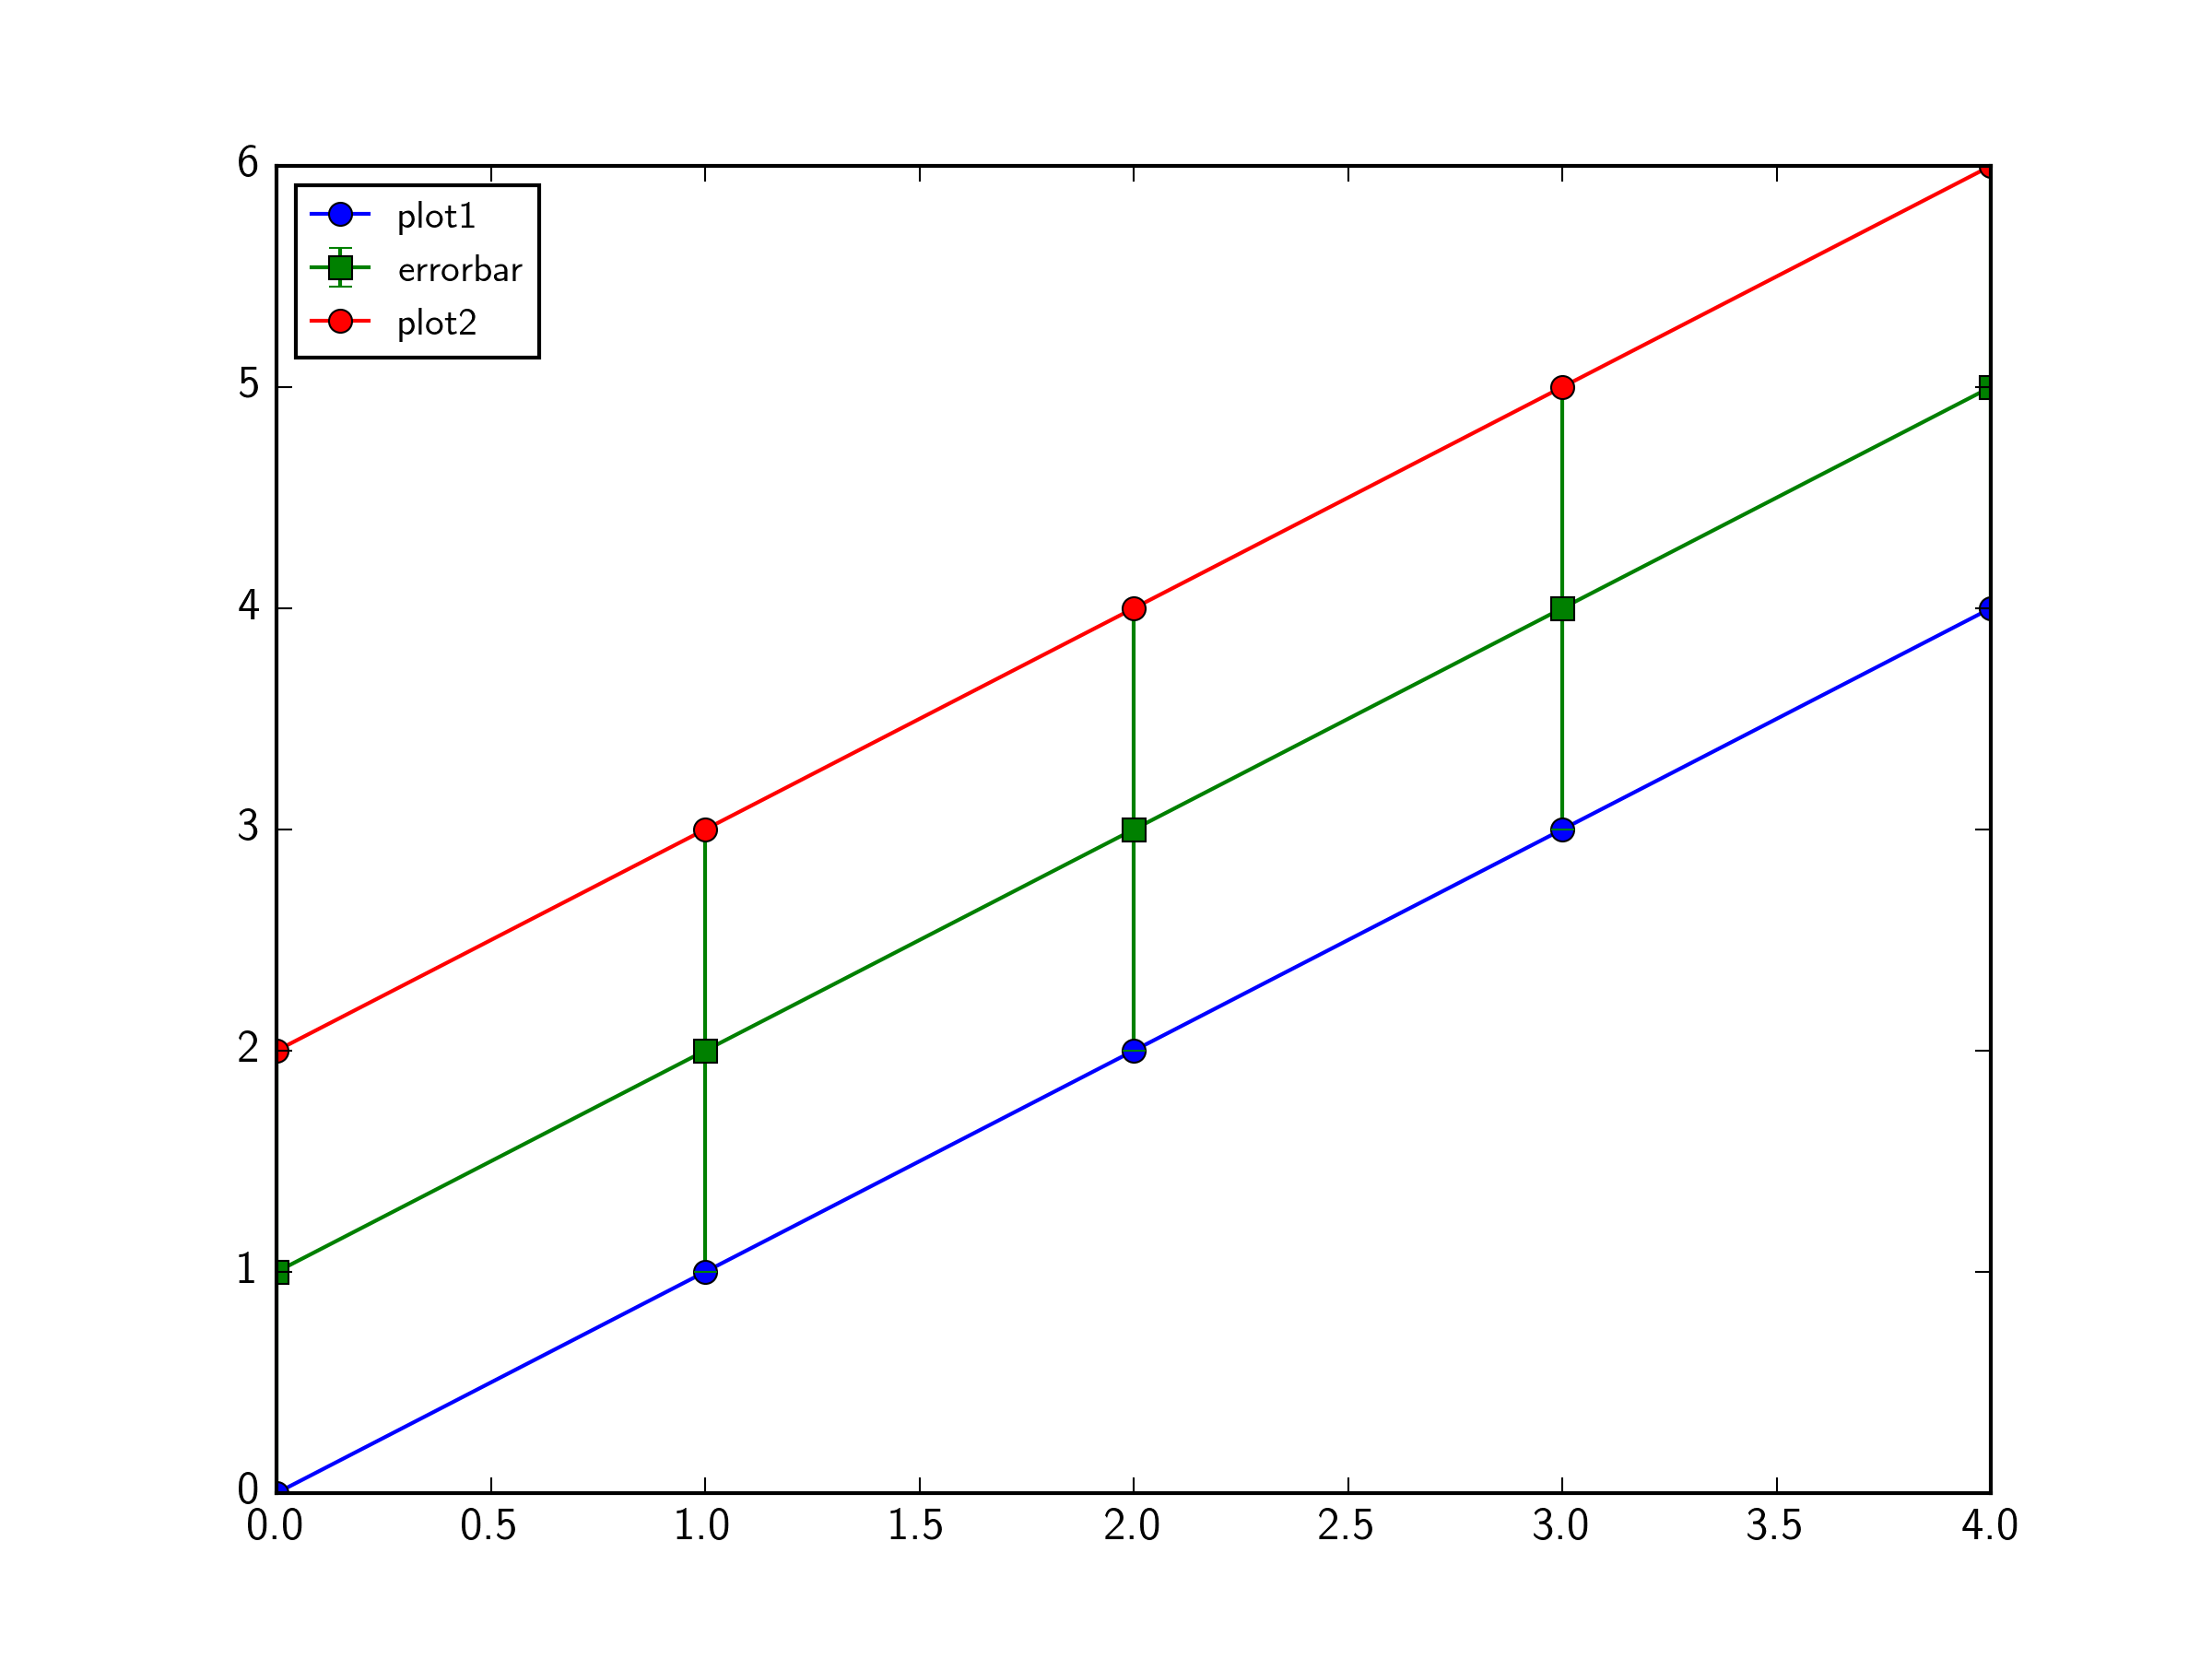
ax.plot(np.arange(5),np.arange(5),'bo-',label='plot1')
ax.errorbar(np.arange(5),np.arange(1,6),yerr=1,marker='s',color='g',label='errorbar')
ax.plot(np.arange(5),np.arange(2,7),'ro-',label='plot2')
handles,labels = ax.get_legend_handles_labels()
handles = [handles[0], handles[2], handles[1]]
labels = [labels[0], labels[2], labels[1]]
ax.legend(handles,labels,loc=2)
plt.show()
关于python - 图例中的顺序图 python,我们在Stack Overflow上找到一个类似的问题: https://stackoverflow.com/questions/36866245/