我想使用 Python 和 wxPython 显示一个实时图表,其中包含一条或两条曲线,每秒最多 50 个样本。 该小部件应同时支持 Win32 和 Linux 平台。
欢迎任何提示。
编辑添加:
我不需要以 50 fps 的速度更新显示,但需要在两条曲线上显示最多 50 个数据样本,并具有合理的显示更新速率(5..10 fps 应该没问题)。
编辑添加:
我在一个成功的项目中使用了 mathplotlib。 然后我为其他项目选择了 wx.lib.plot,我发现它更简单,但更容易使用并且消耗更少的 CPU 周期。由于 wx.lib 是标准 wxPython 发行版的一部分,因此特别易于使用。
最佳答案
如果您希望以最少的代码占用空间获得高性能,Python 的内置绘图库 tkinter 是您的不二之选。无需编写特殊的 C/C++ 代码或使用大型绘图包即可获得比 50 fps 更好的性能。
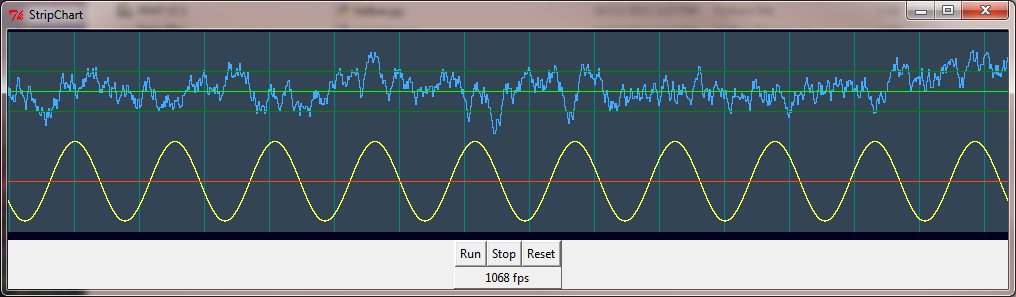
以下代码在 2.2 GHz Core 2 duo 上以 400 fps 的速度滚动 1000x200 条形图,在 3.4 GHz Core i3 上以 1000 fps 的速度滚动。中央例程“scrollstrip”在右边缘绘制一组数据点和相应的颜色以及可选的垂直网格条,然后将条形图向左滚动 1。要绘制水平网格条,只需将它们包含在数据和颜色中数组作为常量以及您的可变数据点。
from tkinter import *
import math, random, threading, time

class StripChart:

    def __init__(self, root):
        self.gf = self.makeGraph(root)
        self.cf = self.makeControls(root)
        self.gf.pack()
        self.cf.pack()
        self.Reset()

    def makeGraph(self, frame):
        self.sw = 1000
        self.h = 200
        self.top = 2
        gf = Canvas(frame, width=self.sw, height=self.h+10,
                    bg="#002", bd=0, highlightthickness=0)
        gf.p = PhotoImage(width=2*self.sw, height=self.h)
        self.item = gf.create_image(0, self.top, image=gf.p, anchor=NW)
        return(gf)

    def makeControls(self, frame):
        cf = Frame(frame, borderwidth=1, relief="raised")
        Button(cf, text="Run", command=self.Run).grid(column=2, row=2)
        Button(cf, text="Stop", command=self.Stop).grid(column=4, row=2)
        Button(cf, text="Reset", command=self.Reset).grid(column=6, row=2)
        self.fps = Label(cf, text="0 fps")
        self.fps.grid(column=2, row=4, columnspan=5)
        return(cf)

    def Run(self):
        self.go = 1
        for t in threading.enumerate():
            if t.name == "_gen_":
                print("already running")
                return
        threading.Thread(target=self.do_start, name="_gen_").start()

    def Stop(self):
        self.go = 0
        for t in threading.enumerate():
            if t.name == "_gen_":
                t.join()

    def Reset(self):
        self.Stop()
        self.clearstrip(self.gf.p, '#345')

    def do_start(self):
        t = 0
        y2 = 0
        tx = time.time()
        while self.go:
            y1 = 0.2*math.sin(0.02*math.pi*t)
            y2 = 0.9*y2 + 0.1*(random.random()-0.5)
            self.scrollstrip(self.gf.p,
               (0.25+y1,   0.25, 0.7+y2,   0.6,     0.7,   0.8),
               ( '#ff4', '#f40', '#4af', '#080', '#0f0', '#080'),
                 "" if t % 65 else "#088")

            t += 1
            if not t % 100:
                tx2 = time.time()
                self.fps.config(text='%d fps' % int(100/(tx2 - tx)))
                tx = tx2
#            time.sleep(0.001)

    def clearstrip(self, p, color):  # Fill strip with background color
        self.bg = color              # save background color for scroll
        self.data = None             # clear previous data
        self.x = 0
        p.tk.call(p, 'put', color, '-to', 0, 0, p['width'], p['height'])

    def scrollstrip(self, p, data, colors, bar=""):   # Scroll the strip, add new data
        self.x = (self.x + 1) % self.sw               # x = double buffer position
        bg = bar if bar else self.bg
        p.tk.call(p, 'put', bg, '-to', self.x, 0,
                  self.x+1, self.h)
        p.tk.call(p, 'put', bg, '-to', self.x+self.sw, 0,
                  self.x+self.sw+1, self.h)
        self.gf.coords(self.item, -1-self.x, self.top)  # scroll to just-written column
        if not self.data:
            self.data = data
        for d in range(len(data)):
            y0 = int((self.h-1) * (1.0-self.data[d]))   # plot all the data points
            y1 = int((self.h-1) * (1.0-data[d]))
            ya, yb = sorted((y0, y1))
            for y in range(ya, yb+1):                   # connect the dots
                p.put(colors[d], (self.x,y))
                p.put(colors[d], (self.x+self.sw,y))
        self.data = data            # save for next call

def main():
    root = Tk()
    root.title("StripChart")
    app = StripChart(root)
    root.mainloop()

main()
关于python - wxPython 最好的实时绘图小部件是什么?,我们在Stack Overflow上找到一个类似的问题: https://stackoverflow.com/questions/457246/