我正在使用 matplotlib 绘制一些图,但我遇到了 TeX 渲染的问题。似乎 mathtext x-height 比普通的 Bitstream Vera Sans 小一点。请参阅以下示例:
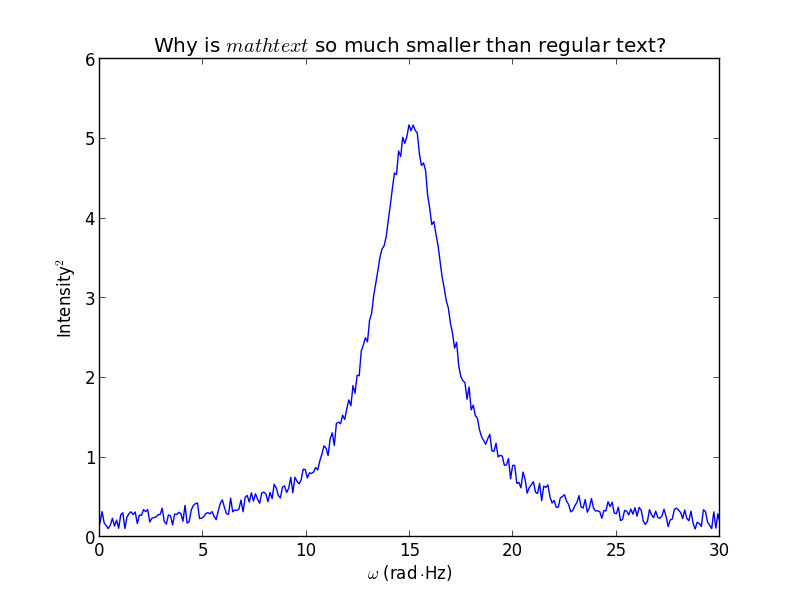
x = linspace(0, 30, 300);
y = 0.5*rand(300)+20/(numpy.power(x-15, 2)+4);
xlabel(r'$\omega$ (rad$\cdot$Hz)');
ylabel(r'Intensity$^2$');
title(r'Why is $mathtext$ so much smaller than normal text?');
如您所见,希腊字母和数字尤其明显。理想情况下,我能够定义一些缩放因子,使每种字体大小的数学文本都更大一些。有什么办法可以简单地做到这一点?我不想只想在任何地方都使用 Computer Modern。我也不想编译新的 Tex 数学字体,如果可能的话。
我会采用的一种解决方案是对希腊字母和数字使用无衬线字体,但无论出于何种原因,matplotlib 都会忽略这些字体的格式:
title('Why does $mat\mathsf{plot}lib$ ignore formatting for $\mathsf{2}$ ($\mathsf{two}), $\mathbf{2}$ ($\mathbf{two}) and $\mathsf{\omega}$?')

我认为这与这些内容的排版方式有关,但有什么办法可以解决这个问题吗?
最佳答案
来自matplotlib docs :
Additionally, you can use
\mathdefault{...}or its alias\mathregular{...}to use the font used for regular text outside of mathtext. There are a number of limitations to this approach, most notably that far fewer symbols will be available, but it can be useful to make math expressions blend well with other text in the plot.
关于python - Matplotlib:更改数学字体大小,我们在Stack Overflow上找到一个类似的问题: https://stackoverflow.com/questions/15836050/