我有这个代码
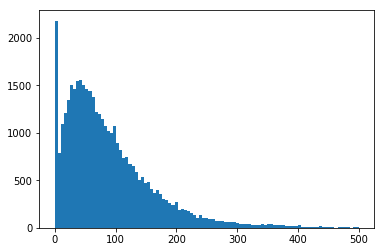
df1 = df['T1'].values

df1 = df1 [~np.isnan(df1 )].tolist()

plt.hist(df1 , bins='auto', range=(0,100))
plt.show()
这给了我这张图
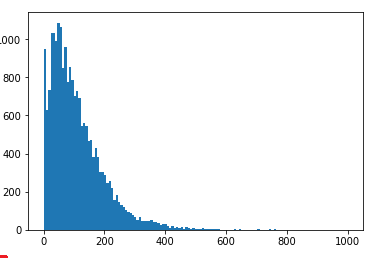
和这段代码
df2 = df['T2'].values

df2 = df2 [~np.isnan(df2 )].tolist()

plt.hist(df2 , bins='auto', range=(0,100))
plt.show()
这给了我这个
有什么方法可以将直方图转换为曲线,然后将它们组合在一起?
像这样
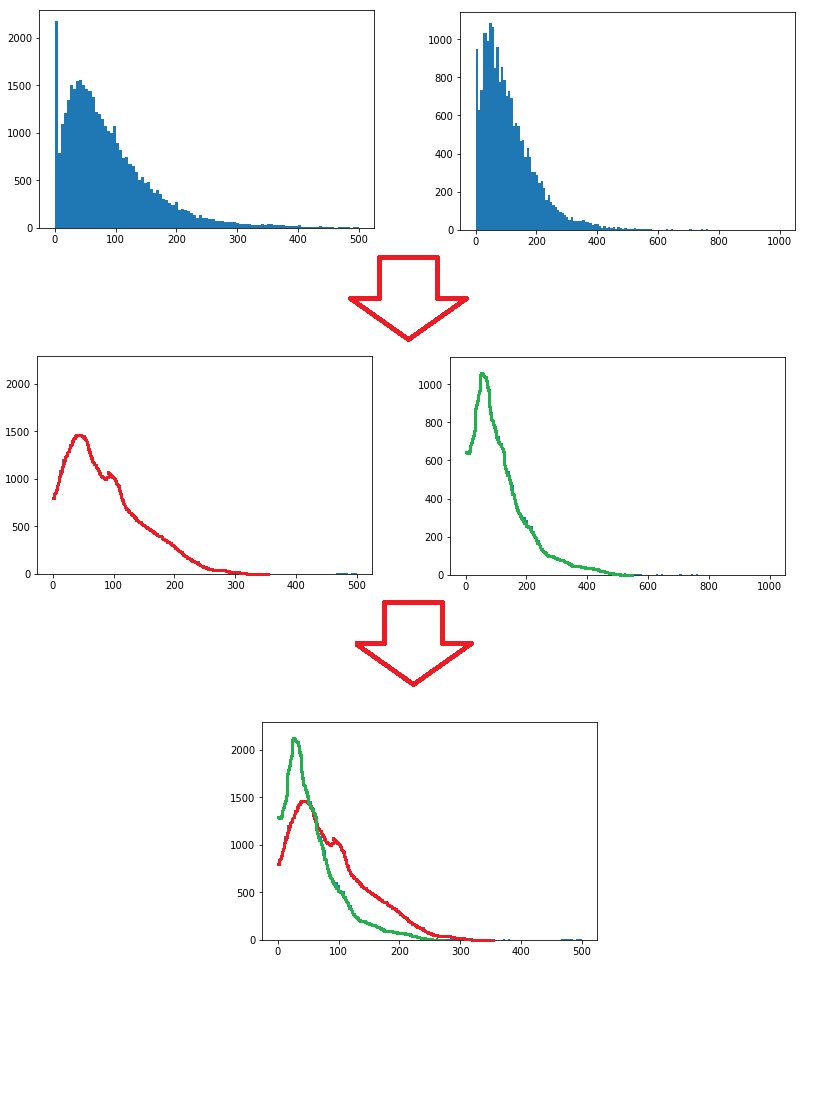
最佳答案
可能你想画这样的台阶
import numpy as np
import matplotlib.pyplot as plt

d1 = np.random.rayleigh(30, size=9663)
d2 = np.random.rayleigh(46, size=8083)

plt.hist(d1 , bins=np.arange(100), histtype="step")
plt.hist(d2 , bins=np.arange(100), histtype="step")
plt.show()

关于python - 在 Python 中将直方图转换为曲线,我们在Stack Overflow上找到一个类似的问题: https://stackoverflow.com/questions/55582695/