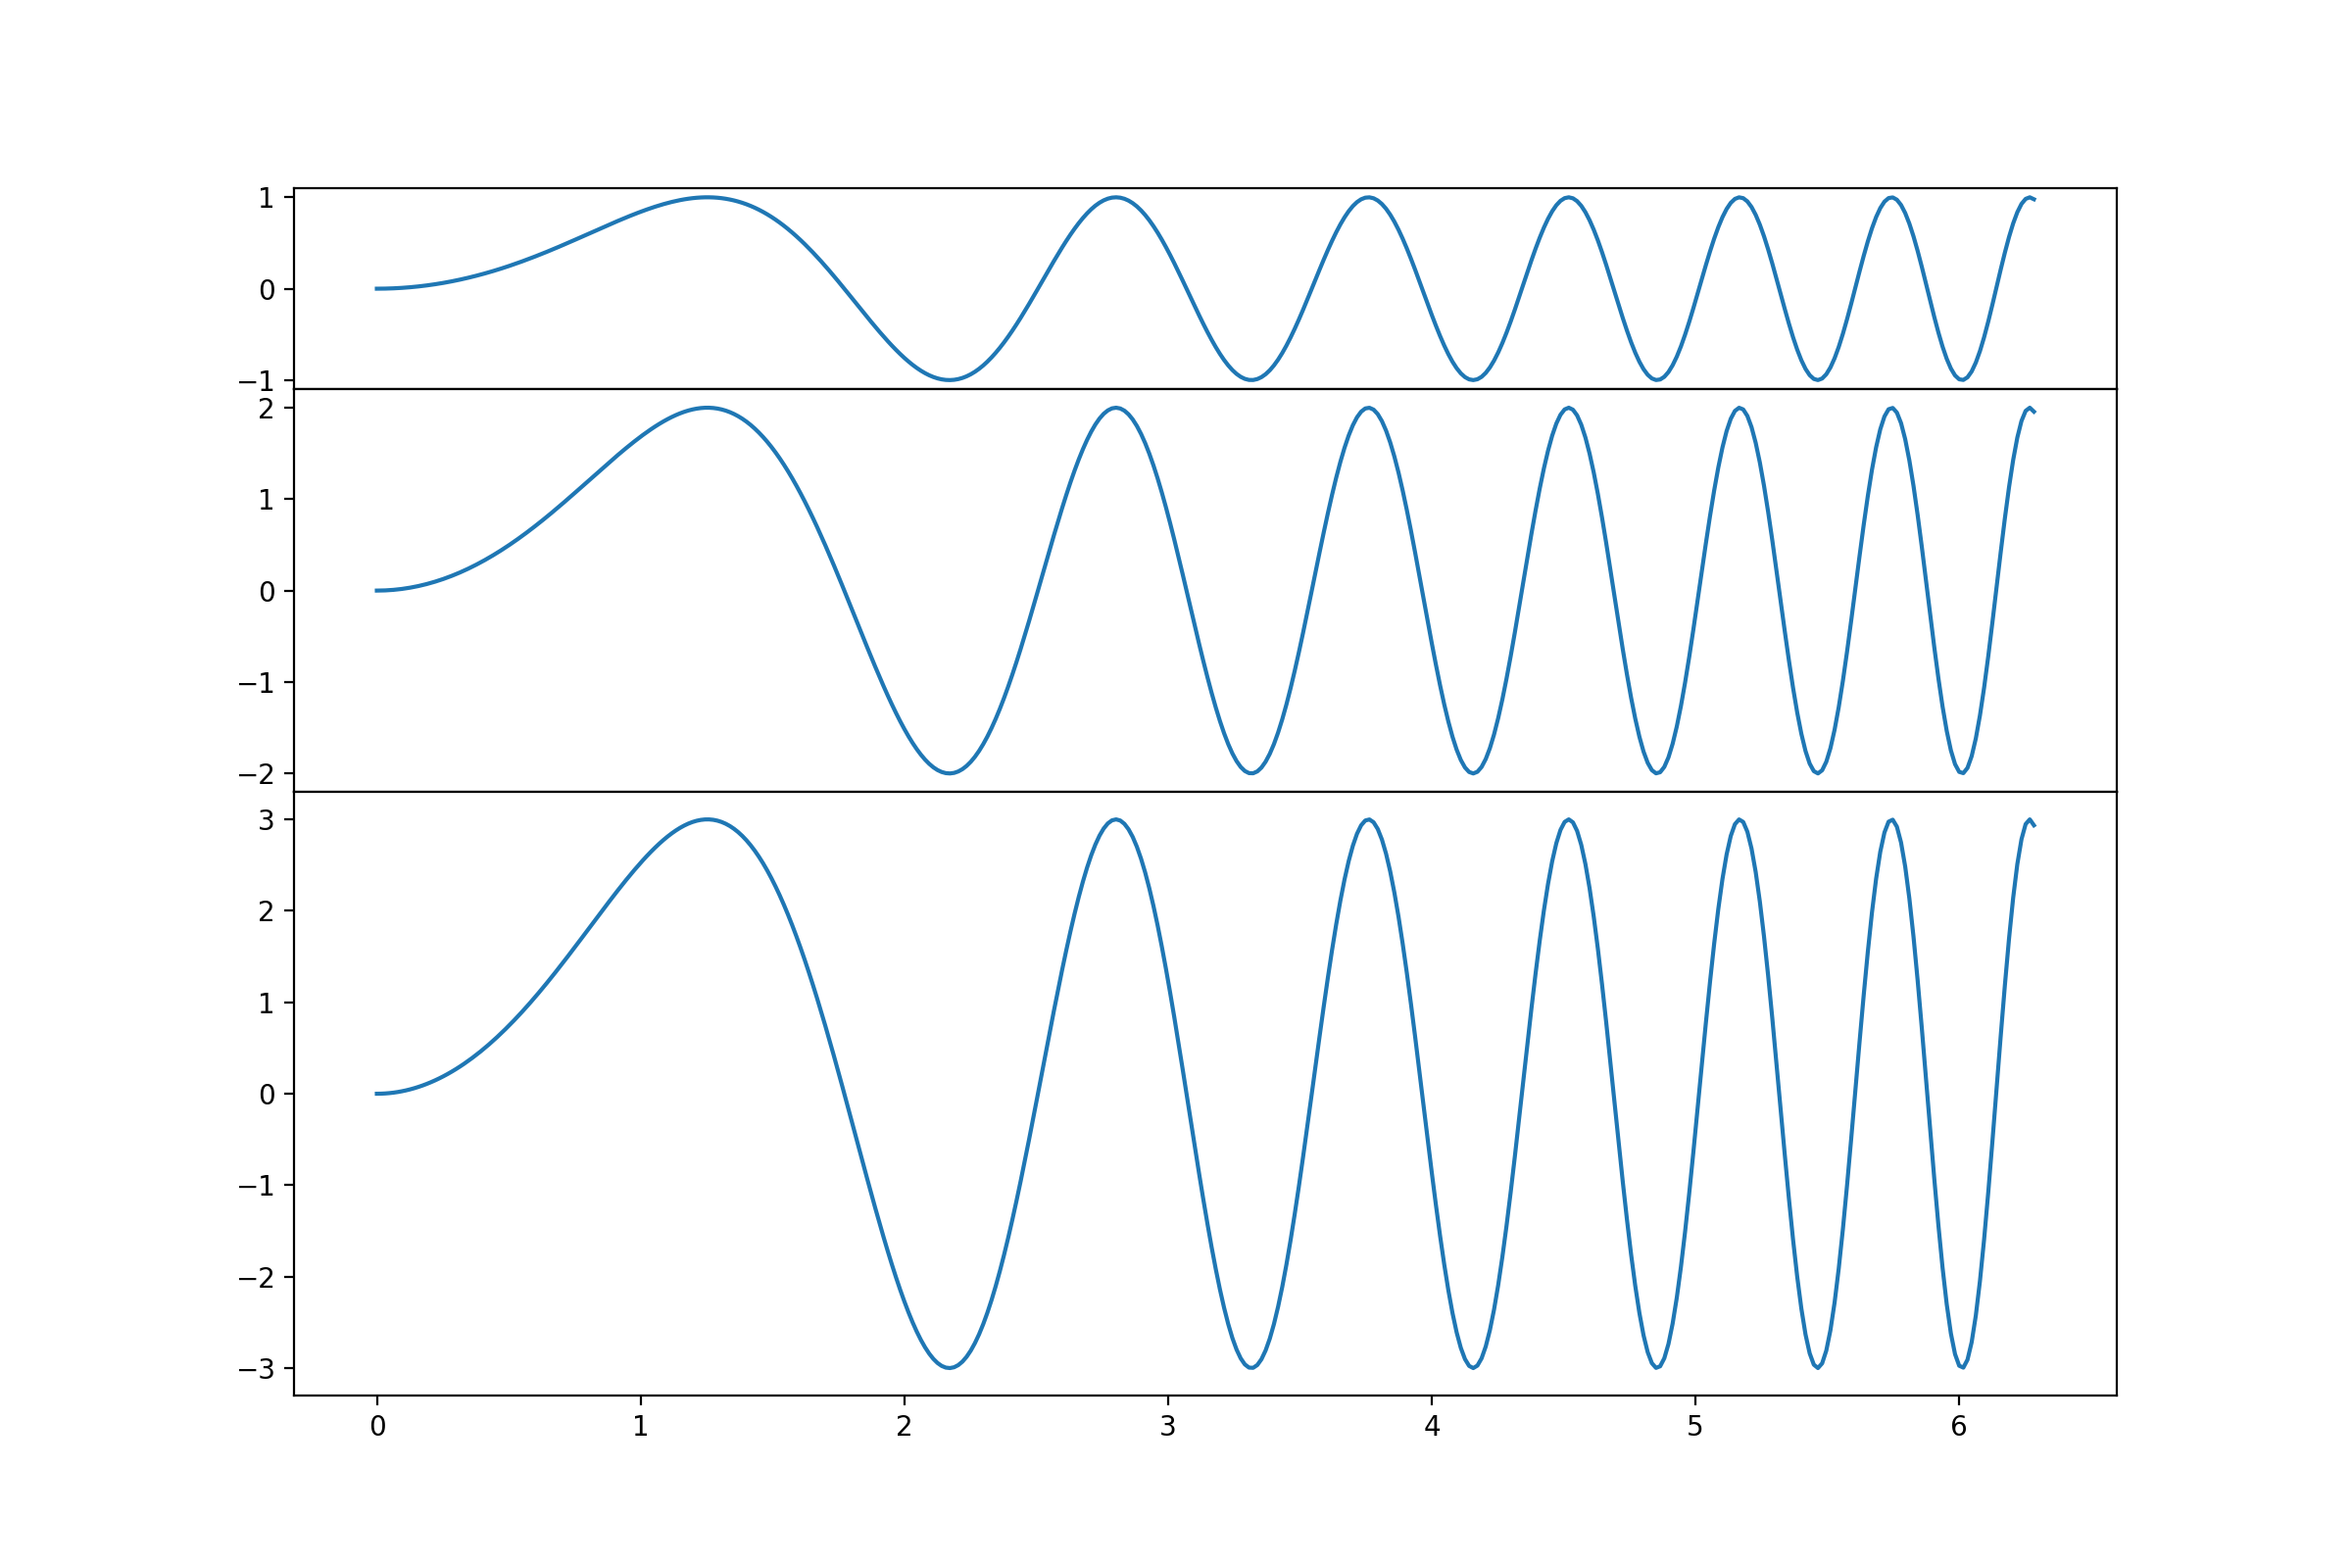
我想根据数据跨度自动缩放共享 x 轴图形的子图的垂直高度!我想比较显示数据的相对强度。如果我对子图使用 sharey=True kwarg,则数据将以相对强度可识别的方式显示:
    import matplotlib.pyplot as plt
    from matplotlib import gridspec
    import numpy as np

    SIZE = (12, 8) #desired overall figure size


    # Simple data to display in various forms
    x = np.linspace(0, 2 * np.pi, 400)

    y = np.sin(x ** 2)
    y2 = 2*(np.sin(x ** 2))
    y3 = 3*(np.sin(x ** 2))


    fig, ax = plt.subplots(3,ncols=1, sharex=True, sharey=True)
    fig.set_size_inches(SIZE[1], SIZE[0])
    fig.subplots_adjust(hspace=0.001)


    ax[0].plot(x, y)
    ax[1].plot(x, y2)
    ax[2].plot(x, y3)
    plt.show()
所有子图现在都具有相同的高度,并且可以识别 y 轴中的数据跨度,因为数据以正确的相对比例显示。 我想要实现的是每个情节的比例在数据结束的地方结束。基本上消除了未使用的空白区域。子图的大小将代表数据的相对高度比。它们在 Y 轴上仍应具有相同的缩放比例,以便查看者估计相对数据高度(例如,哪个冷是计数率)。
我发现了以下类似问题的链接,但没有一个真正帮助我解决问题:
最佳答案
这是一个为您确定比率并相应地创建子图的示例:
import matplotlib.pyplot as plt
from matplotlib import gridspec
import numpy as np

SIZE = (12, 8) #desired overall figure size

# Simple data to display in various forms
x = np.linspace(0, 2 * np.pi, 400)

# the maximum multiplier for the function
N = 3

# the y-ranges:
ys = [i * np.sin(x**2) for i in range(1,N+1)]

# the maximum extent of the plot in y-direction (cast as int)
hs = [int(np.ceil(np.max(np.abs(y)))) for y in ys]

# determining the size of the GridSpec:
gs_size = np.sum(hs)
gs = gridspec.GridSpec(gs_size,1)

# the figure
fig = plt.figure(figsize = SIZE)

# creating the subplots
base = 0
ax = []
for y,h in zip(ys,hs):
    ax.append(fig.add_subplot(gs[base:h+base,:]))
    base += h
    ax[-1].plot(x,y)

##fig, ax = plt.subplots(3,ncols=1, sharex=True, sharey=True)
##fig.set_size_inches(SIZE[1], SIZE[0])
fig.subplots_adjust(hspace=0.001)


##ax[0].plot(x, ys[0])
##ax[1].plot(x, ys[1])
##ax[2].plot(x, ys[2])
plt.show()
代码确定每组数据的最大 y 轴扩展,将其转换为整数,然后使用这些扩展的总和作为 GridSpec 的比例将图形划分为子图。 .
结果图如下所示:
在 Python 3.5 上测试
编辑:
如果您的数据的最大范围和最小范围不可比较,最好更改方式 hs计算成
hs = [int(np.ceil(np.max(y))) - int(np.floor(np.min(y))) for y in ys]
关于python - Matplotlib 自动缩放共享 x 轴图形的子图的垂直高度,我们在Stack Overflow上找到一个类似的问题: https://stackoverflow.com/questions/44903768/