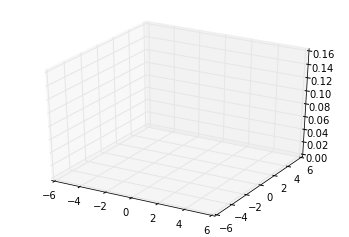
我试图通过 matplotlib 绘制高斯分布,但我得到的只是一个空数字:
当我搜索互联网时,我了解到 ax.plot_surface() 需要三个参数。函数、X 值、Y 值和 Z(根据 X、Y 计算 Z 的函数)。这是正确的吗?
我发布下面的代码希望你能帮助我找出我在这里做错了什么。谢谢!
import numpy as np
import matplotlib.pyplot as plt
from mpl_toolkits.mplot3d import Axes3D

###############################################
### The multivariate Gaussian density function
###############################################

def pdf_multivariate_gauss(x, mu, cov):
    '''
    Caculate the multivariate normal density (pdf)

    Keyword arguments:
        x = numpy array of a "d x 1" sample vector
        mu = numpy array of a "d x 1" mean vector
        cov = "numpy array of a d x d" covariance matrix
    '''
    assert(mu.shape[0] > mu.shape[1]), 'mu must be a row vector'
    assert(x.shape[0] > x.shape[1]), 'x must be a row vector'
    assert(cov.shape[0] == cov.shape[1]), 'covariance matrix must be square'
    assert(mu.shape[0] == cov.shape[0]), 'cov_mat and mu_vec must have the same dimensions'
    assert(mu.shape[0] == x.shape[0]), 'mu and x must have the same dimensions'
    part1 = 1 / ( ((2* np.pi)**(len(mu)/2)) * (np.linalg.det(cov)**(1/2)) )
    part2 = (-1/2) * ((x-mu).T.dot(np.linalg.inv(cov))).dot((x-mu))
    return float(part1 * np.exp(part2))

# Test
x = np.array([[0],[0]])
mu  = np.array([[0],[0]])
cov = np.eye(2)

print(pdf_multivariate_gauss(x, mu, cov))

#prints 0.15915494309189535

###############################################
### The plot
###############################################

mu  = np.array([[0],[0]])
cov = np.eye(2)

def construct_Z(X, Y, mu, cov):
    Z = []
    for i,j in zip(X,Y):
        x = np.array([i,j]).reshape(2,1)
        Z.append(pdf_multivariate_gauss(x, mu, cov))
    return Z

X = linspace(-5, 5, 200)
Y = linspace(-5, 5, 200)
Z = construct_Z(X, Y, mu, cov)

fig = plt.figure()
ax = fig.add_subplot(111, projection='3d')
ax.plot_surface(X, Y, Z, rstride=1, cstride=1, color='0.8',
                       alpha=0.85, linewidth=1)
plt.show()
最佳答案
我不是 matplotlib 中 3D 绘图的专家,但我相信你的数据是错误的。
正如您在 this tutorial 的源代码中看到的那样,您的 X,Y 和 Z 数据必须是二维数组。您的 X 和 Y 是一维的,而您的 Z 是一个简单的列表。
尝试将数据 reshape 为网格,可能使用X, Y = np.meshgrid(X, Y)
关于python - 尝试绘制多元高斯分布。在 3D 绘图中 matplotlib 返回一个空图形,我们在Stack Overflow上找到一个类似的问题: https://stackoverflow.com/questions/23101977/