我正在尝试制作圆形衍射图案, 它有一个被一系列环包围的中心点。 它涉及到代码中定义的贝塞尔积分来完成此操作。
我的问题是它花费的时间太长,比如我等了 10 分钟代码才运行,但没有显示任何内容。我明白这是因为我的贝塞尔积分每点有 1000 次迭代,有人可以帮忙解决这个问题吗?
我走在正确的道路上吗?
我正在尝试通过 Mark Newman 的书《计算物理》自学 Python 和计算物理,练习是计算物理的 5.4。这里是本章的链接。它位于第 9 页。 http://www-personal.umich.edu/~mejn/cp/chapters/int.pdf
这是我正在尝试制作的图像。
 .
.
我的代码:
import numpy as np
import pylab as plt
import math as mathy

#N = number of slicices
#h = b-a/N

def J(m,x): #Bessel Integral
    def f(theta):
        return (1/mathy.pi)*mathy.cos(m*theta - x*mathy.sin(theta)) #I replaced np. with mathy. for this line

    N = 1000
    A = 0
    a=0
    b=mathy.pi
    h = ((b-a)/N)

    for k in range(1,N,2):

        A +=  4*f(a + h*k)

    for k in range(2,N,2):

        A +=  2*f(a + h*k)

    Idx =  (h/3)*(A + f(a)+f(b))

    return Idx

def I(lmda,r): #Intensity
    k = (mathy.pi/lmda)
    return ((J(1,k*r))/(k*r))**2

wavelength = .5        # microm meters
I0 = 1
points = 500
sepration = 0.2

Intensity = np.empty([points,points],np.float)

for i in range(points):
    y = sepration*i
    for j in range(points):
        x = sepration*j
        r = np.sqrt((x)**2+(y)**2)

        if r < 0.000000000001:
            Intensity[i,j]= 0.5 #this is the lim as r  -> 0, I -> 0.5
        else:
            Intensity[i,j] = I0*I(wavelength,r)

plt.imshow(Intensity,vmax=0.01,cmap='hot')
plt.gray()
plt.show()
最佳答案
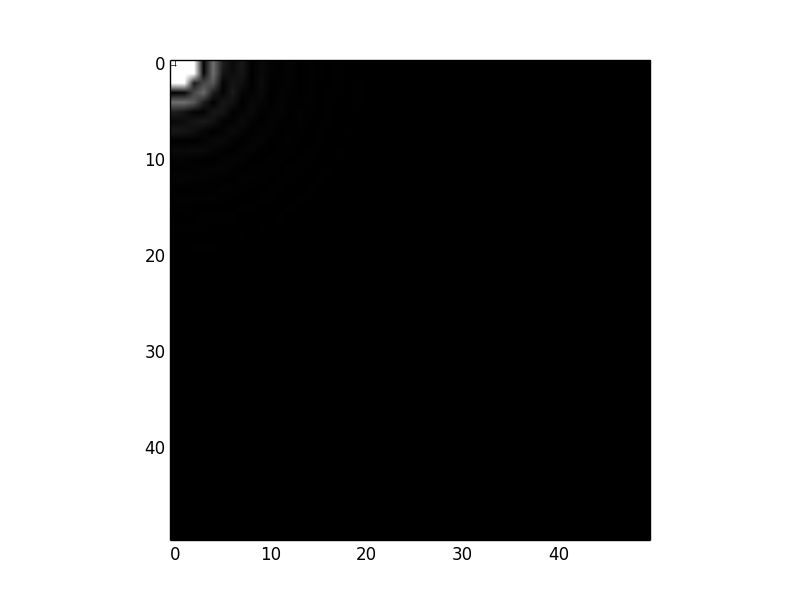
如果我将 N 减少到 100(从 1000),并将图像大小(点)减少到 50(从 500),您的代码似乎运行良好。执行时间大约 4 秒后,我得到以下图像:
以下是我们使用 cProfile 分析代码时得到的结果:
$ python -m cProfile -s time bessel.py | head -n 10
         361598 function calls (359660 primitive calls) in 3.470 seconds

   Ordered by: internal time

   ncalls  tottime  percall  cumtime  percall filename:lineno(function)
   252399    2.250    0.000    2.250    0.000 bessel.py:24(f)
     2499    0.821    0.000    3.079    0.001 bessel.py:23(J)
        1    0.027    0.027    3.472    3.472 bessel.py:15(<module>)
     2499    0.015    0.000    3.093    0.001 bessel.py:45(I)
        1    0.013    0.013    0.013    0.013 backend_macosx.py:1(<module>)
所以看来你的大部分执行时间都花在了f上。您可以优化此函数,或者尝试使用 PyPy 运行代码。 PyPy 非常擅长优化这类事情。您需要安装他们的 numpy 版本(请参阅 http://pypy.readthedocs.org/en/latest/getting-started.html# )。但是 PyPy 在我的机器上用了 40 秒就完成了你的原始代码(删除了绘图内容)。
编辑
我的系统上的 PyPy 中尚未安装plotlib,因此我在最后替换了您的 plt 调用
#plt.imshow(Intensity,vmax=0.01,cmap='hot')
#plt.gray()
#plt.show()
np.savetxt('bessel.txt', Intensity)
并创建了一个单独的程序,我使用普通的 Python 执行该程序,其中包含:
import numpy as np
import pylab as plt

Intensity = np.loadtxt('bessel.txt')

plt.imshow(Intensity,vmax=0.01,cmap='hot')
plt.gray()
plt.show()
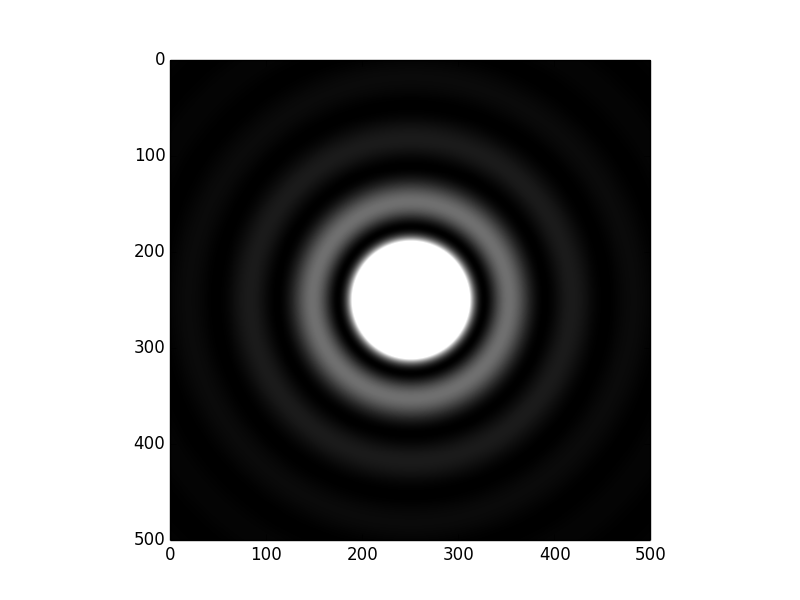
这会生成下图,并对您的代码进行以下修改:
sepration = 0.008 # decrease separation

Intensity = np.empty([points,points],np.float)

for i in range(points):
    y = sepration*(i - points/2) # centre on image
    for j in range(points):
        x = sepration*(j - points/2)
关于python - 用Python绘制密度图,用贝塞尔积分制作衍射图案,但它不会停止运行,我们在Stack Overflow上找到一个类似的问题: https://stackoverflow.com/questions/23879745/