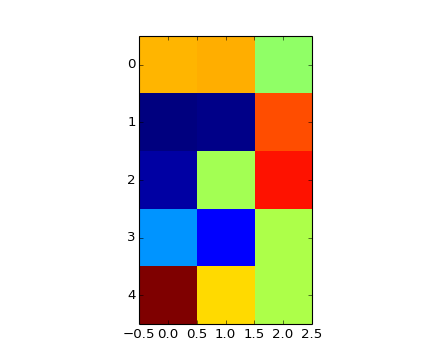
假设我有一个用 imshow 绘制的数据,生成如下内容:
X = 10*np.random.rand(5,3)

fig, ax = plt.subplots()
ax.imshow(X, cmap=cm.jet, interpolation='nearest')
我想在这张图像上绘制散点图,我知道该怎么做。
但是,我希望标记大小完全适合用 imshow 绘制的数据单元格。即,在前面的示例中,数据为 5 x 3。如果我在 [0, 0] 位置上绘制 X 标记,我希望它填充橙色单元格区域。
ax.scatter(0,0, marker='x')

我知道scatter有一个尺寸参数,但我不知道如何计算这个尺寸。
提前谢谢您。
编辑 - 尝试@Hyry 在下面的答案中发布的代码。
这是我绘制一些点的代码:
def plot_singularities(x_dim, y_dim, x_steps, y_steps, min_points,
                                              max_points, scalar_field, file_path):
    """
    Plot the singularities of the rotational free scalar field
    :param x_dim : the x dimension of the scalar field
    :param y_dim : the y dimension of the scalar field
    :param x_steps : the discretization in x of the vector field
    :param y_steps : the discretization in y of the vector field
    :param scalar_field : the scalar_field to be plot
    :param min_points : a set (x, y) of min points of the scalar field
    :param max_points : a set (x, y) of max points of the scalar field
    """
    plt.figure()

    ## Plot the scalar field level curves
    x, y = numpy.mgrid[-x_dim/2:x_dim/2:x_steps*1j, -y_dim/2:y_dim/2:y_steps*1j]

    plt.contour(x, y, scalar_field, colors='white', zorder=1, extent=[-x_dim/2.0, x_dim/2.0, -y_dim/2.0, y_dim/2.0])

    ## Plot the critical points
    x = numpy.linspace(-x_dim/2, x_dim/2, x_steps)
    y = numpy.linspace(-y_dim/2, y_dim/2, y_steps)

    # Draw the min points
    x_indices = numpy.nonzero(min_points)[0]
    y_indices = numpy.nonzero(min_points)[1]
    rgba_colors = numpy.zeros((len(x_indices), 4))
    rgba_colors[:, 1] = 0.5
    rgba_colors[:, 3] = min_points[numpy.nonzero(min_points)]
    scatter = plt.scatter(x[x_indices], y[y_indices], color=rgba_colors, marker='$\\otimes$', s=1, zorder=2)
    scatter.__class__ = DataPathCollection
我得到了一个更大的标记(绿色的):
我的数据是 100 x 100。标记不应该变小吗?
编辑2:
通过一些测试,我发现问题与 imshow 函数中的 extent 参数有关:
X = 10*np.random.rand(5,5)
fig, ax = plt.subplots()
plt.imshow(X, cmap="jet", interpolation='nearest', extent=[-5, 5, -5, 5])
scatter = plt.scatter(0,0, marker='x', s=1)
scatter.__class__ = DataPathCollection
plt.show()
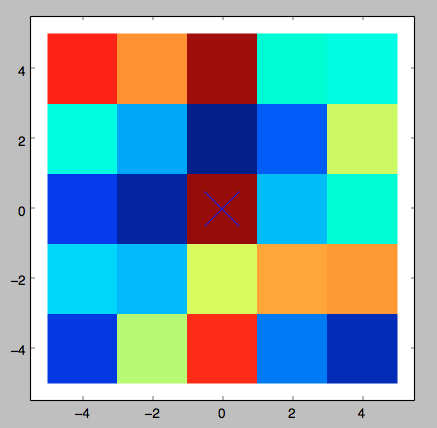
我如何调整代码来克服这种情况?
谢谢。
最佳答案
PathCollection的大小是在屏幕坐标系中的,在数据坐标系中无法设置它。这是一个在数据坐标系中缩放路径的示例。您可以将 PathCollection 对象的 __class__ 更改为 DataPathCollection。
十字标记的原始路径为-0.5 ~ 0.5。
from matplotlib.collections import PathCollection
import pylab as pl
import numpy as np
class DataPathCollection(PathCollection):
def draw(self, renderer):
if self._sizes is not None:
affine = self.axes.transData.get_affine()
m = affine.get_matrix()
m[:, 2] = 0
m[2, :] = 0
self._transforms = [affine.scale(x, x) for x in self._sizes]
return Collection.draw(self, renderer)
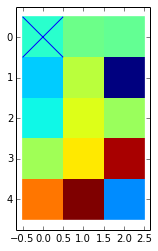
X = 10*np.random.rand(5,3)
fig, ax = pl.subplots()
ax.imshow(X, cmap="jet", interpolation='nearest')
scatter = ax.scatter(0,0, marker='x', s=1)
scatter.__class__ = DataPathCollection
这是输出:
关于python - 调整散点标记大小以适合 imshow 单元格大小,我们在Stack Overflow上找到一个类似的问题: https://stackoverflow.com/questions/25416677/