我正在生成一些基本的高斯滤波演示,但得到了特殊的输出图,因为它们不是线性模糊的。下面的代码导入任何图像,然后应用 std (sigma) 值 1、大小 5 的高斯滤波器。
我认为这可能是有限与无限滤波器阵列假设问题,但不确定。 conv2 函数不是我自己的,而是我在此处找到的 Matlabs conv2 函数的类似函数。
import numpy as np
from PIL import Image
import matplotlib.pyplot as plt
from scipy.ndimage.filters import convolve


def conv2(x,y):
    """
    This function the 2D convolution of two 2D input array x and y.

    Parameters
    ----------
    x : ndarray
    y : ndarray

    Returns
    ----------
    z : convolved image output

    Usage:
    z = conv2(x,y,mode='same')

    """

    # Add singleton dimensions
    if (len(x.shape) < len(y.shape)):
        dim = x.shape
        for i in range(len(x.shape),len(y.shape)):
            dim = (1,) + dim
        x = x.reshape(dim)
    elif (len(y.shape) < len(x.shape)):
        dim = y.shape
        for i in range(len(y.shape),len(x.shape)):
            dim = (1,) + dim
        y = y.reshape(dim)

    origin = ()

    # Apparently, the origin must be set in a special way to reproduce
    # the results of scipy.signal.convolve and Matlab
    for i in range(len(x.shape)):
        if ( (x.shape[i] - y.shape[i]) % 2 == 0 and
             x.shape[i] > 1 and
             y.shape[i] > 1):
            origin = origin + (-1,)
        else:
            origin = origin + (0,)

    z = convolve(x,y, mode='constant', origin=origin)

    return z


# Question 1 - Guassian Blur
def Gaussian_filter(gamma, N):
    """
    Create the Gaussian filters
    """
    Amp = 1 / (2*np.pi*gamma**2)
    x = np.arange(-N,N,0.5)
    y = np.arange(-N,N,0.5)
    [x,y] = np.meshgrid(x,y)
    g = Amp * np.exp(-(x**2 + y **2)/(2*gamma**2))
    return g

im = Image.open("/home/will/Downloads/lenaTest3.jpg")
arr = np.array(im)

sigma=1
N=5
gaus = Gaussian_filter(sigma,5)

plt.figure(1)
plt.subplot(1,4,1)
plt.imshow(arr,cmap='gray')
plt.subplot(1,4,2)
plt.imshow(gaus,cmap='gray')
plt.subplot(1,4,3)
plt.imshow(conv2(arr,gaus),cmap='gray',vmin=0,vmax=255)
plt.subplot(1,4,4)
plt.imshow(arr-conv2(arr,gaus),cmap='gray',vmin=0,vmax=255)
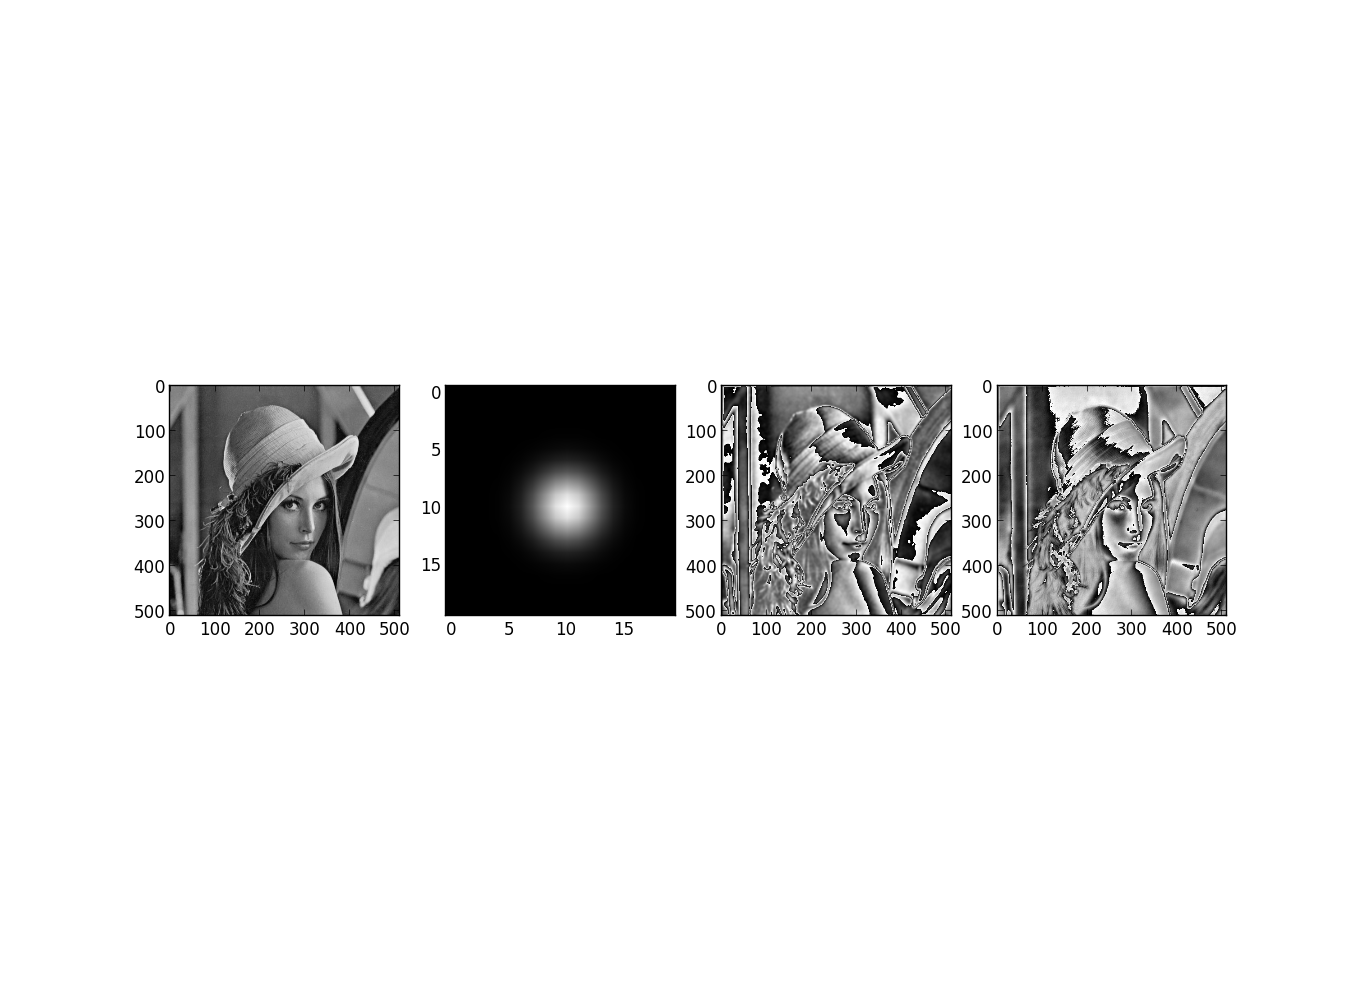
您可以在右侧的两幅图像中看到高斯模糊并不规则。注意:它适用于较高的 stdev (sigma) 值,例如10.
最佳答案
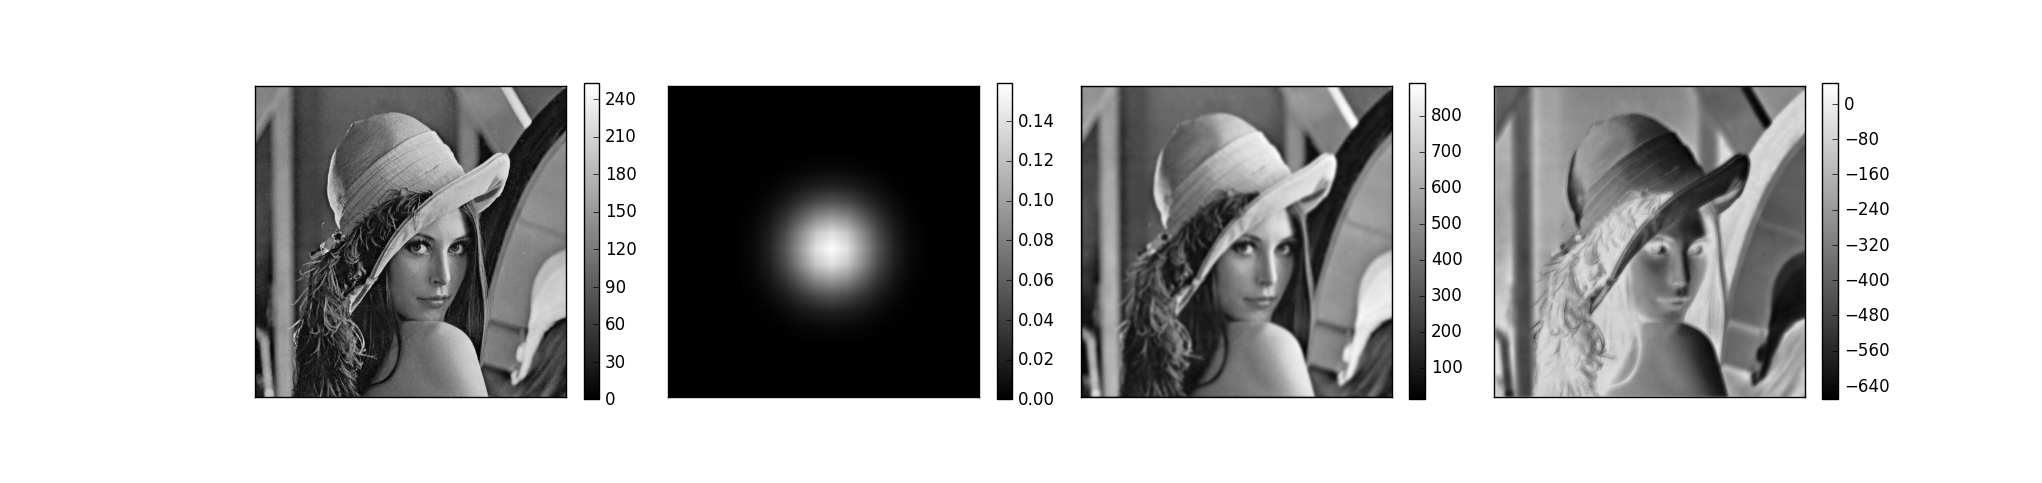
看起来像是8位的问题integer overflow 。您可以处理 float 图像,并避免此类问题:arr = np.array(im, dtype=np.float32)。
顺便说一句,为什么不使用 scipy.signal.convolve2d ?
比转换一些 MATLAB 代码更安全(我看到它给出了与您的函数不同的结果)。
您的完整代码应如下所示:
import numpy as np
from PIL import Image
import matplotlib.pyplot as plt
from scipy.signal import convolve2d

def Gaussian_filter(gamma, N):
    Amp = 1 / (2*np.pi*gamma**2)
    x = np.arange(-N,N,0.5)
    y = np.arange(-N,N,0.5)
    [x,y] = np.meshgrid(x,y)
    g = Amp * np.exp(-(x**2 + y **2)/(2*gamma**2))
    return g

if __name__ == "__main__":
    im = Image.open(r"C:\Users\eladj\Desktop\lena.jpg")
    arr = np.array(im, dtype=np.float32)

    sigma = 1
    N = 5

    gaus = Gaussian_filter(sigma,5)
    im_blurred = convolve2d(arr, gaus, mode='same')
    im_DoG = arr - im_blurred

    plt.figure(1)
    plt.subplot(1,4,1)
    plt.imshow(arr, cmap='gray')
    plt.colorbar(fraction=0.046)
    plt.xticks([]), plt.yticks([])
    plt.subplot(1,4,2)
    plt.imshow(gaus, cmap='gray')
    plt.colorbar(fraction=0.046)
    plt.xticks([]), plt.yticks([])
    plt.subplot(1,4,3)
    plt.imshow(im_blurred, cmap='gray')
    plt.colorbar(fraction=0.046)
    plt.xticks([]), plt.yticks([])
    plt.subplot(1,4,4)
    plt.imshow(im_DoG, cmap='gray')
    plt.colorbar(fraction=0.046)
    plt.xticks([]), plt.yticks([])
注意每个图像的灰度值。
关于python - 具有低标准差的高斯图像滤波图。值(value)观,我们在Stack Overflow上找到一个类似的问题: https://stackoverflow.com/questions/37721773/