有什么方法可以使用 Python matplotlib 和/或 pandas 创建两级分组条形图(即 x 轴上的组)。
显示了我的意思的一个例子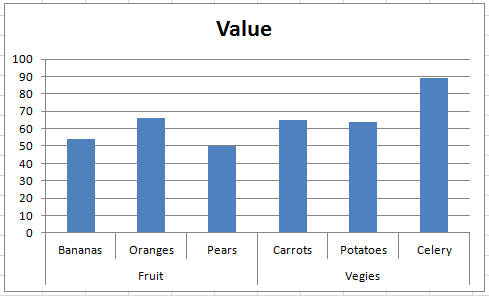
最佳答案
显然这是在 wishlist 上. Here's帖子中提到的一个示例可以执行您想要的操作,但具有几个功能。
但是,一个快速的解决方案是并排绘制两个条形图并稍微自定义图形。
import matplotlib.pyplot as plt
import pandas as pd
import numpy as np

#create multindex dataframe
arrays = [['Fruit', 'Fruit', 'Fruit', 'Veggies', 'Veggies', 'Veggies'],
          ['Bananas', 'Oranges', 'Pears', 'Carrots', 'Potatoes', 'Celery']]
index = pd.MultiIndex.from_tuples(list(zip(*arrays)))
df = pd.DataFrame(np.random.randint(10, 50, size=(1, 6)), columns=index)

#plotting
fig, axes = plt.subplots(nrows=1, ncols=2, sharey=True, figsize=(14 / 2.54, 10 / 2.54))  # width, height
for i, col in enumerate(df.columns.levels[0]):
    print(col)
    ax = axes[i]
    df[col].T.plot(ax=ax, kind='bar', width=.8)

    ax.legend_.remove()
    ax.set_xlabel(col, weight='bold')
    ax.yaxis.grid(b=True, which='major', color='black', linestyle='--', alpha=.4)
    ax.set_axisbelow(True)

    for tick in ax.get_xticklabels():
        tick.set_rotation(0)

#make the ticklines invisible
ax.tick_params(axis=u'both', which=u'both', length=0)
plt.tight_layout()
# remove spacing in between
fig.subplots_adjust(wspace=0)  # space between plots

plt.show()

关于python - 两级分组图,我们在Stack Overflow上找到一个类似的问题: https://stackoverflow.com/questions/38211326/