Pandas 有时决定以不同的方式绘制具有时间索引的 DataFrame。
我正在使用 df.plot() 绘制 pandas timeseries DataFrame 并为不同的列获取不同的行为,如日期的显示方式,但不明白为什么。
我正在绘制 6 月 18 日的数据,因此有时 x 轴显示小时 06:00、08:00...,有时以非常困惑的方式显示日期/小时:06-18 06、06-18 08、 ...
为什么 ? 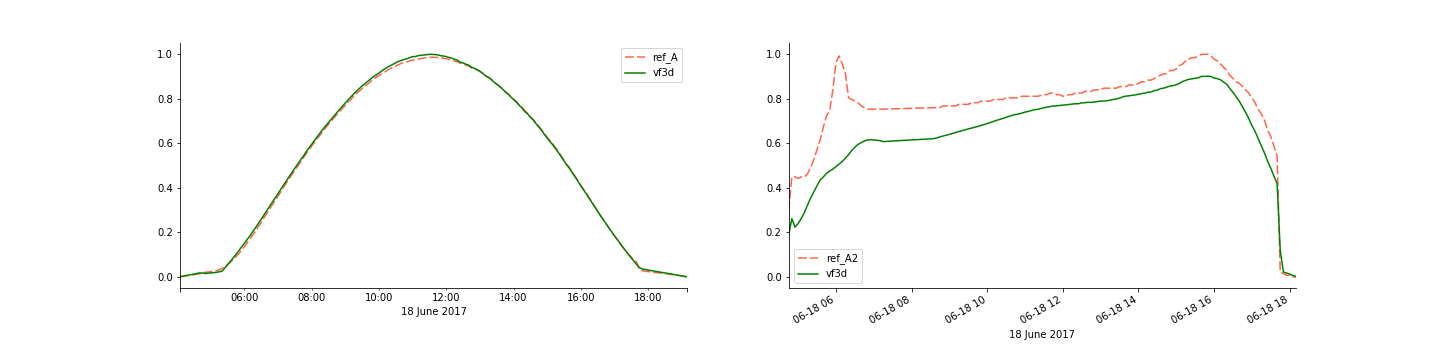
最佳答案
让我们创建一个最小的示例。数据间隔相等,间隔恰好 5 小时(5:00、10:00、15:00)。
import pandas as pd
import matplotlib.pyplot as plt

index = pd.to_datetime(["2019-09-11 05:00:00",
                        "2019-09-11 10:00:30",
                        "2019-09-11 15:00:00"])

pd.DataFrame({"x" : [1,2,4], "y" : [3,4,4]}, index=index).plot()
plt.show()
这将导致这个情节:

现在,让我们为其中一个日期时间添加 30 秒,
index = pd.to_datetime(["2019-09-11 05:00:00",
                        "2019-09-11 10:00:30",  # <-- added 30 seconds here
                        "2019-09-11 15:00:00"])
现在数据不再等距,结果是这样的:

所以在后一种情况下 pandas does not consider it as "ts_plot" 。 “ts”大概代表时间序列,但有人可能会说两者都是时间序列。但当然后一种情况不能重新采样 - 所以这似乎是潜在的区别。
不幸的是,pandas 将格式化程序与这种时间序列绑定(bind)在一起,并且无法手动更改。
通过将 x_compat=True 放入 plot 函数中,您可以获得一致的结果。这将确保不会独立于数据使用类似“ts”的轴。它总是会导致第二种情节。
df.plot(x_compat=True)
这样做的好处是您可以通过matplotlib.dates formatters and locators手动更改这些正常绘图的格式。 .
关于python - 与 pandas 数据框中的日期绘制保持一致,我们在Stack Overflow上找到一个类似的问题: https://stackoverflow.com/questions/57884594/