我正在处理一些 matplotlib 图,需要有一个放大的插图。这可以通过 zoomed_inset_axes 实现来自 axes_grid1工具包。参见示例 here :
import matplotlib.pyplot as plt

from mpl_toolkits.axes_grid1.inset_locator import zoomed_inset_axes
from mpl_toolkits.axes_grid1.inset_locator import mark_inset

import numpy as np

def get_demo_image():
    from matplotlib.cbook import get_sample_data
    import numpy as np
    f = get_sample_data("axes_grid/bivariate_normal.npy", asfileobj=False)
    z = np.load(f)
    # z is a numpy array of 15x15
    return z, (-3,4,-4,3)

fig, ax = plt.subplots(figsize=[5,4])

# prepare the demo image
Z, extent = get_demo_image()
Z2 = np.zeros([150, 150], dtype="d")
ny, nx = Z.shape
Z2[30:30+ny, 30:30+nx] = Z

# extent = [-3, 4, -4, 3]
ax.imshow(Z2, extent=extent, interpolation="nearest",
          origin="lower")

axins = zoomed_inset_axes(ax, 6, loc=1) # zoom = 6
axins.imshow(Z2, extent=extent, interpolation="nearest",
             origin="lower")

# sub region of the original image
x1, x2, y1, y2 = -1.5, -0.9, -2.5, -1.9
axins.set_xlim(x1, x2)
axins.set_ylim(y1, y2)

plt.xticks(visible=False)
plt.yticks(visible=False)

# draw a bbox of the region of the inset axes in the parent axes and
# connecting lines between the bbox and the inset axes area
mark_inset(ax, axins, loc1=2, loc2=4, fc="none", ec="0.5")

plt.draw()
plt.show()
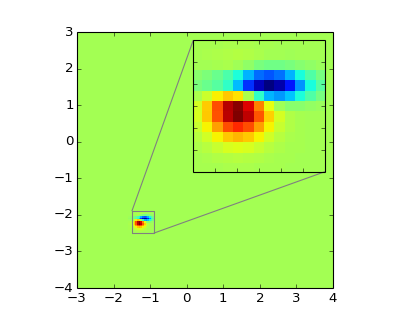
这将给出期望的结果:
 http://matplotlib.org/1.3.1/_images/inset_locator_demo21.png
但正如您在代码中看到的那样,数据必须绘制两次 - 一次用于主轴 (ax.imshow...),一次用于插入轴 (axins.imshow...)。
我的问题是:
有没有办法在主图完成后添加缩放插图,不需要在新轴上再次绘制所有内容?
请注意:我不是在寻找用函数包装绘图调用并让函数绘制 ax 的解决方案和 axins (参见下面的示例),但是(如果存在)一个利用现有数据的 native 解决方案 ax .有人知道这样的解决方案是否存在吗?
这是包装解决方案:
def plot_with_zoom(*args, **kwargs):
    ax.imshow(*args, **kwargs)
    axins.imshow(*args, **kwargs)
它有效,但感觉有点像 hack,因为如果我只想放大现有绘图的某个区域,为什么还需要重新绘制所有数据。
ed-smith 回答后的一些补充说明:
上面的例子当然只是最小的例子。图中可能有许多不同的数据集(数据集我的意思是通过 imshow 或 plot 等绘制的东西)。例如,想象一个包含 10 个点数组的散点图,所有点都是相对于普通 x 绘制的。
正如我在上面所写的,最直接的方法就是使用一个包装器来绘制所有实例中的数据。但我正在寻找的是一种从最后的 ax 开始的方法(如果存在的话)对象(不是单独的绘图命令)并以某种方式创建缩放插图。
最佳答案
我认为以下内容可以满足您的需求。请注意,您将返回的句柄用于第一个 imshow 并将其添加到轴以进行插入。您需要制作一份副本,以便每个图形都有一个单独的句柄,
import matplotlib.pyplot as plt

from mpl_toolkits.axes_grid1.inset_locator import zoomed_inset_axes
from mpl_toolkits.axes_grid1.inset_locator import mark_inset

import numpy as np
import copy

def get_demo_image():
    from matplotlib.cbook import get_sample_data
    import numpy as np
    f = get_sample_data("axes_grid/bivariate_normal.npy", asfileobj=False)
    z = np.load(f)
    # z is a numpy array of 15x15
    return z, (-3,4,-4,3)

fig, ax = plt.subplots(figsize=[5,4])

# prepare the demo image
Z, extent = get_demo_image()
Z2 = np.zeros([150, 150], dtype="d")
ny, nx = Z.shape
Z2[30:30+ny, 30:30+nx] = Z

# extent = [-3, 4, -4, 3]
im = ax.imshow(Z2, extent=extent, interpolation="nearest",
          origin="lower")

#Without copy, image is shown in insert only
imcopy = copy.copy(im)
axins = zoomed_inset_axes(ax, 6, loc=1) # zoom = 6
axins.add_artist(imcopy)

# sub region of the original image
x1, x2, y1, y2 = -1.5, -0.9, -2.5, -1.9
axins.set_xlim(x1, x2)
axins.set_ylim(y1, y2)

plt.xticks(visible=False)
plt.yticks(visible=False)

# draw a bbox of the region of the inset axes in the parent axes and
# connecting lines between the bbox and the inset axes area
mark_inset(ax, axins, loc1=2, loc2=4, fc="none", ec="0.5")

plt.draw()
plt.show()
对于您的包装函数,这类似于,
def plot_with_zoom(*args, **kwargs):
    im = ax.imshow(*args, **kwargs)
    imcopy = copy.copy(im)
    axins.add_artist(imcopy)
但是,由于 imshow 只是将存储在数组 Z 中的数据显示为图像,我认为这个解决方案实际上比对 的两次单独调用要慢即时显示。对于需要更多时间的地 block ,例如contour 图或 pcolormesh,这种方法可能是明智的...
编辑:
超越单个 imshow,以及不同类型的多个图。绘图函数都返回不同的句柄(例如 plot 返回线条列表,imshow 返回 matplotlib.image.AxesImage 等)。您可以在绘制时继续将这些句柄添加到列表(或字典)中(或者如果它们足够相似,则使用 collection)。然后你可以编写一个通用函数,使用缩放轴上的 add_artist 或 add_patch 方法将它们添加到轴上,可能使用 if 类型检查来处理绘图中使用的各种类型。一种更简单的方法可能是遍历 ax.get_children() 并重用不是轴本身元素的任何内容。
另一种选择可能是研究 blitting 技术,rasterization或用于加速动画的其他技术,例如使用 fig.canvas.copy_from_bbox 或 fig.canvas.tostring_rgb 将整个图形复制为图像(参见 why is plotting with Matplotlib so slow? 低)。您还可以绘制图形,将其保存为非矢量图形(使用 savefig 或 StringIO buffer ),读回并绘制放大版本。
关于python - 在 matplotlib 中放大插图而不重新绘制数据,我们在Stack Overflow上找到一个类似的问题: https://stackoverflow.com/questions/33036686/