我正在尝试创建一个连接 4x4 子图网格的漂亮图(使用 gridspec 放置,每个子图为 8x8 像素)。我一直在努力让地 block 之间的间距与我想要告诉它做的事情相匹配。我想问题是由于在图的右侧绘制了一个颜色条,并调整了图在图中的位置以适应。但是,即使没有包含颜色条,这个问题似乎也会出现,这让我更加困惑。它也可能与边距间距有关。下面显示的图像是由相关代码生成的。如您所见,我试图让绘图之间的空间变为零,但它似乎不起作用。任何人都可以建议吗?
fig = plt.figure('W Heat Map', (18., 15.))
gs = gridspec.GridSpec(4,4)
gs.update(wspace=0., hspace=0.)
for index in indices:
    loc = (i,j) #determined by the code
    ax = plt.subplot(gs[loc])
    c = ax.pcolor(physHeatArr[index,:,:], vmin=0, vmax=1500)
    # take off axes
    ax.axis('off')
    ax.set_aspect('equal')
fig.subplots_adjust(right=0.8,top=0.9,bottom=0.1)
cbar_ax = heatFig.add_axes([0.85, 0.15, 0.05, 0.7])
cbar = heatFig.colorbar(c, cax=cbar_ax)
cbar_ax.tick_params(labelsize=16)
fig.savefig("heatMap.jpg")

类似地,在制作一个没有颜色条的正方形图形时:
fig = plt.figure('W Heat Map', (15., 15.))
gs = gridspec.GridSpec(4,4)
gs.update(wspace=0., hspace=0.)
for index in indices:
    loc = (i,j) #determined by the code
    ax = plt.subplot(gs[loc])
    c = ax.pcolor(physHeatArr[index,:,:], vmin=0, vmax=400, cmap=plt.get_cmap("Reds_r"))
    # take off axes
    ax.axis('off')
    ax.set_aspect('equal')
fig.savefig("heatMap.jpg")

最佳答案
当轴纵横比设置为不自动调整时(例如使用 set_aspect("equal") 或数字纵横比,或者通常使用 imshow),有子图之间可能有一些空白,即使 wspace 和 hspace 设置为 0。为了消除图形之间的空白,您可以看看以下问题
- How to remove gaps between *images* in matplotlib?
- How to combine gridspec with plt.subplots() to eliminate space between rows of subplots
- How to remove the space between subplots in matplotlib.pyplot?
你可以先考虑this answer对于第一个问题,解决方案是从各个数组构建一个数组,然后使用pcolor、pcolormesh 绘制这个数组或 imshow。这使得以后添加颜色条特别舒服。
否则请考虑设置数字大小和子图参数,这样就不会留下空白。该计算的公式可在 this answer 中找到。第二个问题。
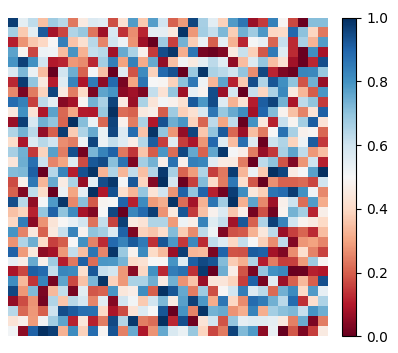
带有颜色条的改编版本看起来像这样:
import matplotlib.pyplot as plt
import matplotlib.colors
import matplotlib.cm
import numpy as np

image = np.random.rand(16,8,8)
aspect = 1.
n = 4 # number of rows
m = 4 # numberof columns
bottom = 0.1; left=0.05
top=1.-bottom; right = 1.-0.18
fisasp = (1-bottom-(1-top))/float( 1-left-(1-right) )
#widthspace, relative to subplot size
wspace=0  # set to zero for no spacing
hspace=wspace/float(aspect)
#fix the figure height
figheight= 4 # inch
figwidth = (m + (m-1)*wspace)/float((n+(n-1)*hspace)*aspect)*figheight*fisasp

fig, axes = plt.subplots(nrows=n, ncols=m, figsize=(figwidth, figheight))
plt.subplots_adjust(top=top, bottom=bottom, left=left, right=right,
                    wspace=wspace, hspace=hspace)
#use a normalization to make sure the colormapping is the same for all subplots
norm=matplotlib.colors.Normalize(vmin=0, vmax=1 )
for i, ax in enumerate(axes.flatten()):
    ax.imshow(image[i, :,:], cmap = "RdBu", norm=norm)
    ax.axis('off')
# use a scalarmappable derived from the norm instance to create colorbar
sm = matplotlib.cm.ScalarMappable(cmap="RdBu", norm=norm)
sm.set_array([])
cax = fig.add_axes([right+0.035, bottom, 0.035, top-bottom])
fig.colorbar(sm, cax=cax)

plt.show()
关于python - 消除 matplotlib 图中子图之间的空白,我们在Stack Overflow上找到一个类似的问题: https://stackoverflow.com/questions/42850225/