我正在使用 Python 3 和 Seaborn 制作分类带状图(请参阅下面的代码和图像)。
每个 strip 图都有 2 个数据点(每种性别一个)。
import numpy as np
import matplotlib.pyplot as plt
import pandas as pd
import seaborn as sns
df = [["city2", "f", 300],
["city2", "m", 39],
["city1", "f", 95],
["city1", "m", 53]]
df = pd.DataFrame(df, columns = ["city", "gender", "variable"])
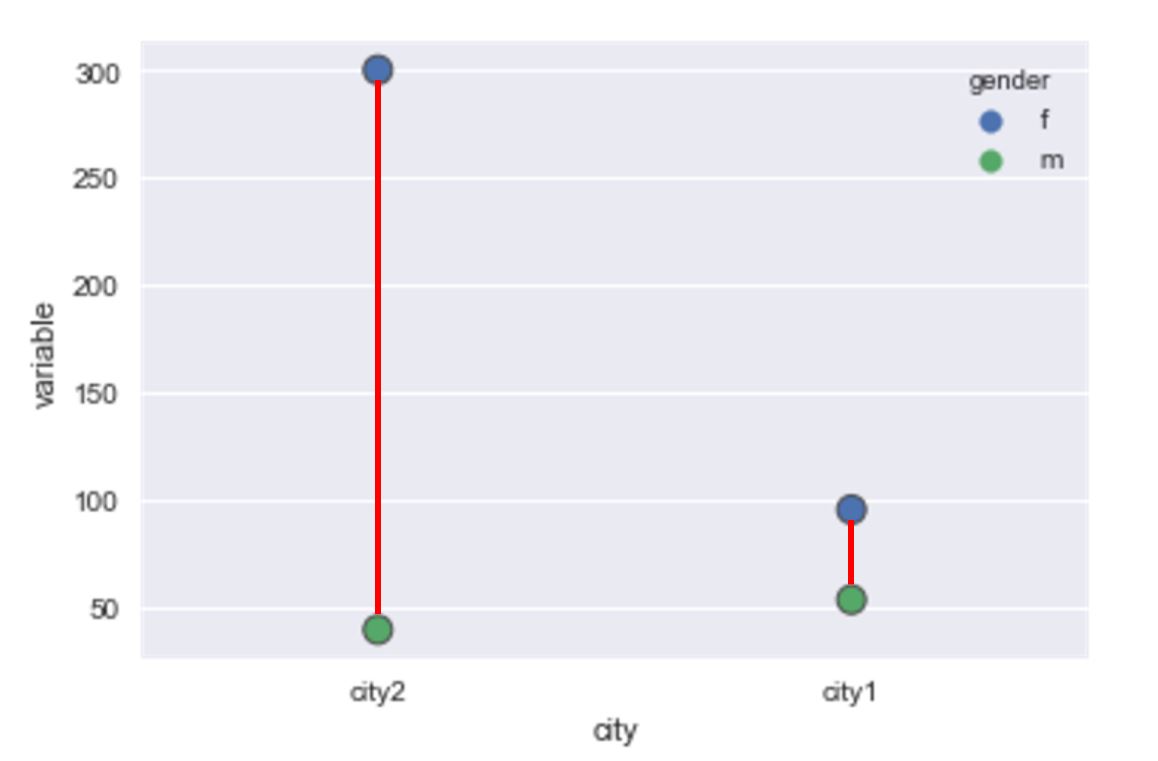
sns.stripplot(data=df,x='city',hue='gender',y='variable', size=10, linewidth=1)
我得到以下输出 
但是,我想要一条线段连接男性点和女性点。我希望该图看起来像这样(见下图)。然而,我手动绘制了这些红线,我想知道是否有一种简单的方法可以使用 Seaborn 或 matplotlib 来完成它。谢谢你!
最佳答案
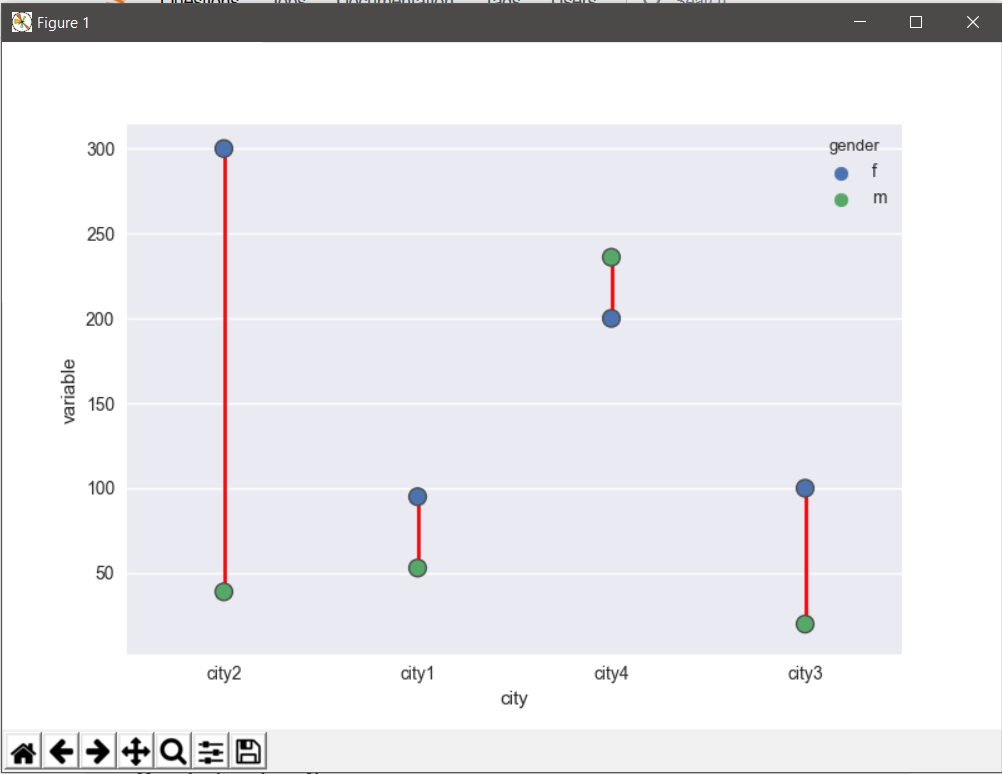
您可以使用 pandas.dataframe.groupby 创建 f-m 对列表,然后绘制对之间的分段:
import numpy as np
import matplotlib.pyplot as plt
from matplotlib import collections  as mc
import pandas as pd
import seaborn as sns


df = [["city2", "f", 300],
      ["city2", "m", 39],
      ["city1", "f", 95],
      ["city1", "m", 53],
      ["city4", "f", 200],
      ["city3", "f", 100],
      ["city4", "m", 236],
      ["city3", "m", 20],]


df = pd.DataFrame(df, columns = ["city", "gender", "variable"])


ax = sns.stripplot(data=df,x='city',hue='gender',y='variable', size=10, linewidth=1)

lines = ([[x, n] for n in group] for x, (_, group) in enumerate(df.groupby(['city'], sort = False)['variable']))
lc = mc.LineCollection(lines, colors='red', linewidths=2)
ax.add_collection(lc)

sns.plt.show()
输出:
关于Python matplotlib/Seaborn stripplot 与点之间的连接,我们在Stack Overflow上找到一个类似的问题: https://stackoverflow.com/questions/44479802/