我试图在海洋模型中描述 70 年代核试验引起的碳同位素扩散的特征。 大气信号是一个强烈的尖峰,它将随着洋流传播到深处(更深的洋流要慢得多)。
我的目标是检测浓度上升的开始以及不同深度水平的增加速率。
我假设海洋碳同位素浓度的行为类似于具有 3 段的分段线性函数:
- 恒定的初始值 (
b) 直到时间 (t_0) - 浓度从时间 (
t_0) 到 (t_1) 线性增加,速率为m1. - 经过一定时间(
t_1)后浓度呈线性下降,下降速率为m2
我在 python 中使用此代码表示该函数:
import numpy as np
import matplotlib.pyplot as plt
import scipy.optimize as sio

def piecewise_linear( t, t0, t1, b, m1, m2 ):
    condlist = [ t < t0,
                (t >= t0 ) & ( t < t1 ),
                t >= t1
               ]
    funclist = [lambda t: b,
                lambda t: b + m1 * ( t - t0 ),
                lambda t: b + m1 * ( t - t0 ) + m2 * ( t - t1 )
               ]
    return np.piecewise( t, condlist, funclist )
对于给定的时间数组 t我希望能够适应此函数的两种“类型”:
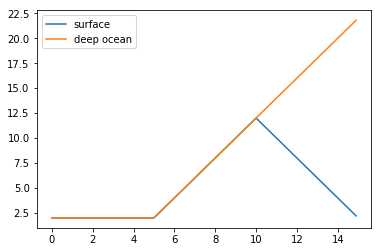
- 完整的 3 段线,代表上层海洋,信号在此处快速传播并且尖峰被完全捕获。
- 一种特殊情况,即在时间序列结束时浓度尚未达到峰值(这代表深海中的信号,需要很长时间才能传播信号)
举个例子
t = np.arange( 0, 15, 0.1 )
y_full = piecewise_linear( t, 5, 10, 2, 2, -4 )
y_cut = piecewise_linear( t, 5, 15, 2, 2, -4 )
plt.plot( t, y_full )
plt.plot( t, y_cut )
plt.legend( [ 'surface', 'deep ocean' ] )
对于第一种情况,当我在添加一些随机噪声后尝试将函数拟合到信号时,我得到了很好的结果:
noise = np.random.normal( 0, 1, len( y_full ) ) * 1
y = y_full
yy = y_full + noise
bounds = ( [ 0, 0, 0, 0, -np.inf ], [ np.inf, np.inf, np.inf, np.inf, 0 ] )
fit,_ = sio.curve_fit( piecewise_linear, t, yy, bounds=bounds )
print( fit )
y_fit = piecewise_linear( t, *tuple( fit ) )
plt.plot( t, yy, color='0.5' )
plt.plot( t, y_fit, linewidth=3 )
plt.plot( t, y, linestyle='--', linewidth=3 )
结果
>>[ 5.00001407 10.01945313 2.13055863 1.95208167 -3.95199719]

但是,当我尝试评估第二种情况(深海)时,我经常得到如下所示的糟糕结果:
noise = np.random.normal( 0, 1, len(y_full ) ) * 1#
y = y_cut
yy = y_cut+noise
bounds = ( [ 0, 0, 0, 0, -np.inf], [ np.inf, np.inf, np.inf, np.inf, 0 ] )
fit,_ = sio.curve_fit( piecewise_linear, t, yy, bounds=bounds )
print( fit )
y_fit = piecewise_linear( t, *tuple( fit ) )
plt.plot( t, yy, color='0.5' )
plt.plot( t, y_fit, linewidth=3 )
plt.plot( t, y, linestyle='--', linewidth=3 )
plt.legend( [ 'noisy data', 'fit', 'original' ] )
我明白了
>>[ 1.83838997 0.40000014 1.51810839 2.56982348 -1.0622842 ]
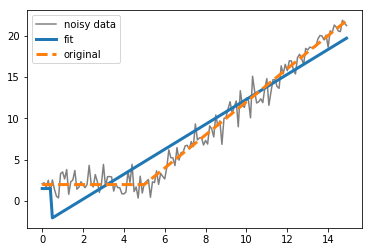
优化确定 t_0大于t_1 ,在这种情况下这是荒谬的。
有没有办法建立条件t_0 < t_1进入曲线拟合?或者我是否必须测试给定哪种类型的曲线,然后拟合两个不同的函数(3 段或 2 段分段线性函数)?
非常感谢任何帮助
最佳答案
您可以考虑使用 lmfit ( https://lmfit.github.io/lmfit-py ) 来实现此目的。 Lmfit 为曲线拟合提供了更高级别的接口(interface),并使拟合参数成为第一类 Python 对象。除此之外,这可以轻松地修复一些参数,并以比 scipy.optimize.curve_fit 所使用的方式更 Pythonic 的方式设置参数的界限。特别是对于您的问题,lmfit 参数还支持使用数学表达式作为所有参数的约束表达式。
要将模型函数 piecewise_linear() 转换为使用 lmfit 进行曲线拟合的模型,您可以执行类似的操作
from lmfit import Model

# make a model
mymodel = Model(piecewise_linear)

# create parameters and set initial values
# note that parameters are *named* from the
# names of arguments of your model function
params = mymodel.make_params(t0=0, t1=1, b=3, m1=2, m2=2)

# now, you can place bounds on parameters, maybe like
params['b'].min = 0
params['m1'].min = 0

# but what you want is an inequality constraint, so
#   1. add a new parameter 'tdiff'
#   2. constrain t1 = t0 + tdiff
#   3. set a minimum value of 0 for tdiff
params.add('tdiff', value=1, min=0)
params['t1'].expr = 't0 + tdiff'

# now perform the fit
result = mymodel.fit(yy, params, t=t)

# print out results
print(result.fit_report())
您可以阅读 lmfit 文档或其他 SO 问题,了解如何从拟合结果中提取其他信息。
关于python - 有没有办法在 scipy.optimize.curve_fit 的参数之间添加依赖关系,我们在Stack Overflow上找到一个类似的问题: https://stackoverflow.com/questions/50451884/