我正在尝试绘制多个时间序列数据。我的代码基于此处接受的答案:
Chart creating dynamically. in .net, c#
但是,我正在绘制多个时间序列数据的数据,这些数据可能来 self 标记为“标签”的不同来源。
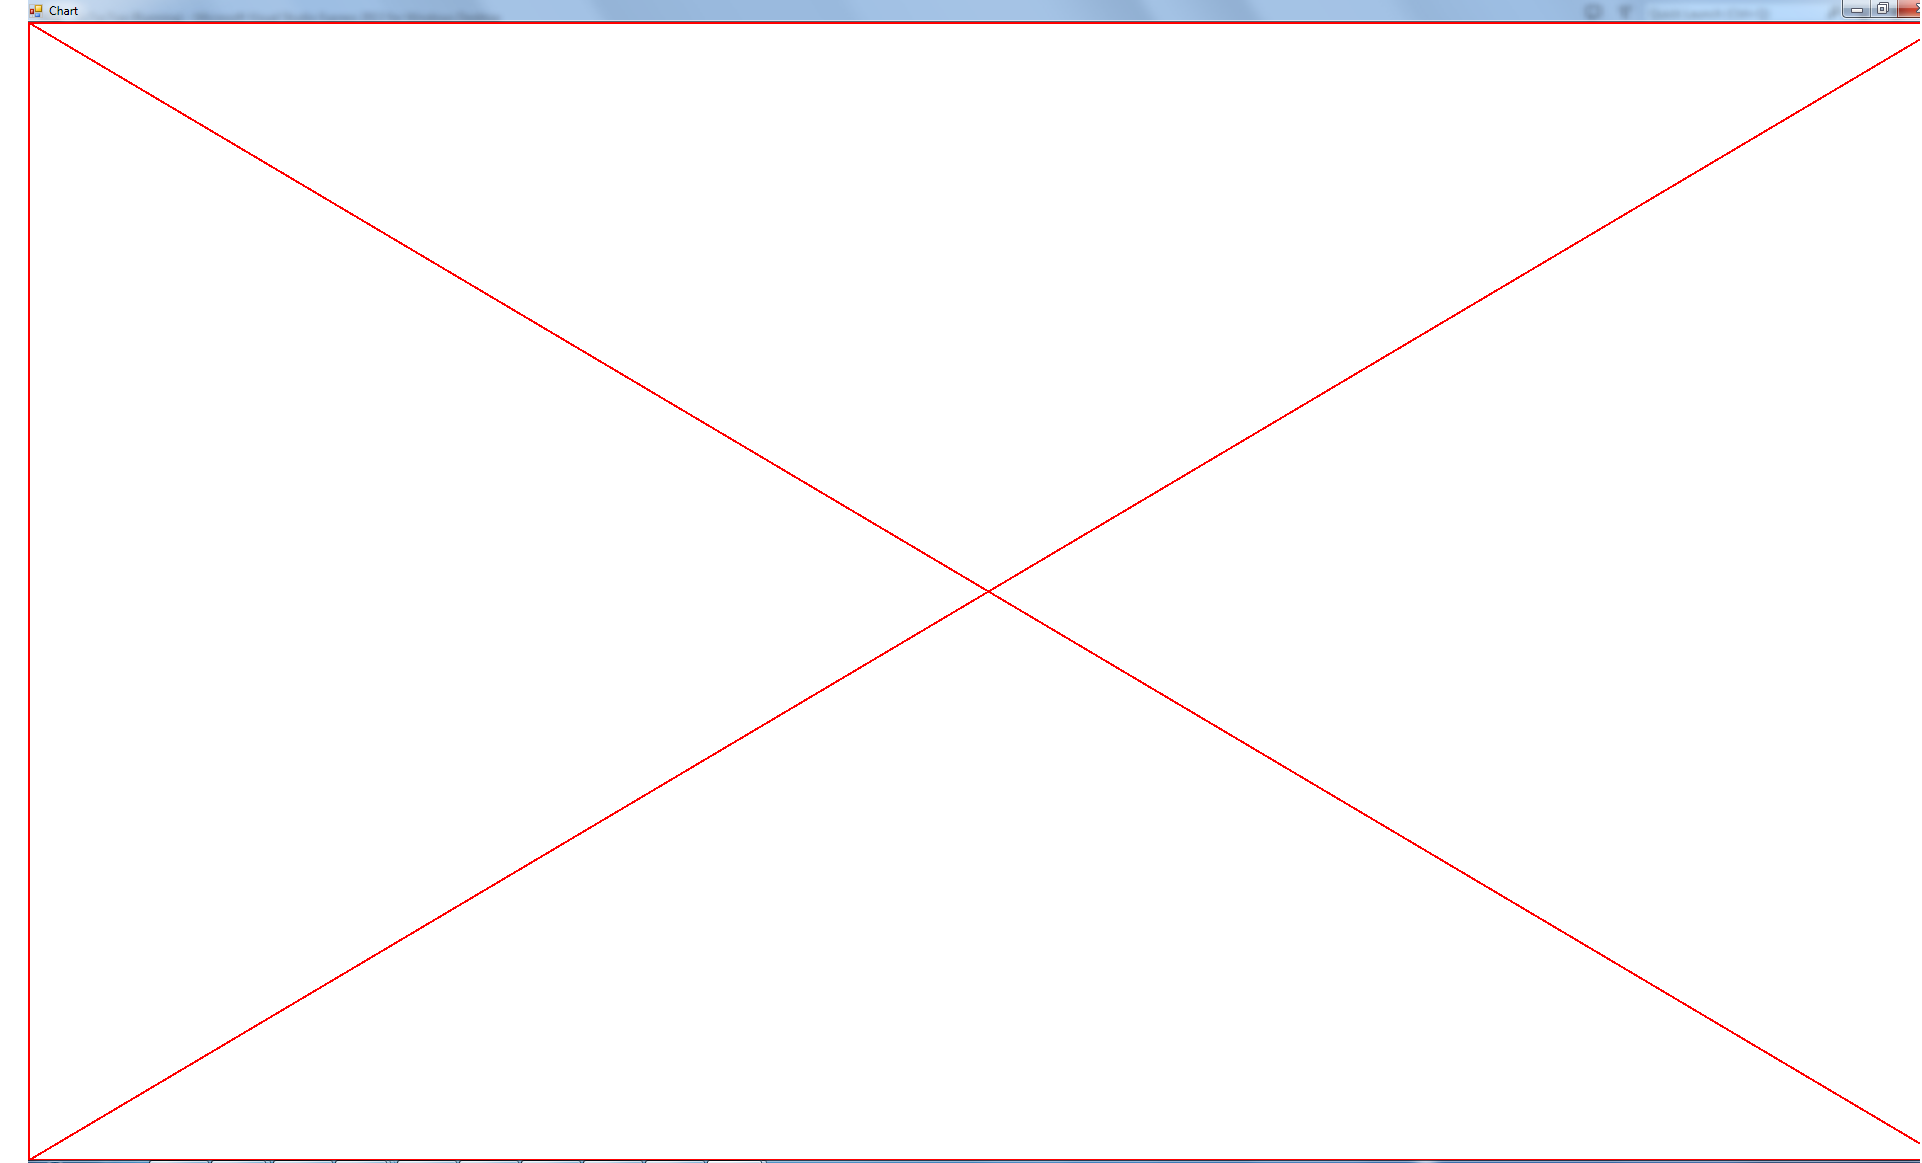
两次从不同来源调用 AddXY 后,我得到了大大的红色 X,但我无法确定这是为什么。下面是我的代码,以及一张大红色 X 的图片,以防我在说什么含糊不清。
可能值得注意的是,我在控制台应用程序中,动态创建 WinForm。
using System;
using System.Collections.Concurrent;
using System.Collections.Generic;
using System.Linq;
using System.Runtime.CompilerServices;
using System.Text;
using System.Threading.Tasks;
using System.Windows.Forms;
using System.Windows.Forms.DataVisualization;
using System.Windows.Forms.DataVisualization.Charting;

namespace MyApplication
{
    public class ChartForm : Form
    {
        private System.ComponentModel.IContainer components = null;
        System.Windows.Forms.DataVisualization.Charting.Chart chart1;
        System.Windows.Forms.DataVisualization.Charting.Series series1;
        ConcurrentDictionary<string, System.Windows.Forms.DataVisualization.Charting.Series> tagToSeriesDict;
        Random r = new Random();

        public ChartForm()
        {
            InitializeComponent();

        }
        private void Form1_Load(object sender, EventArgs e)
        {
            this.tagToSeriesDict = new ConcurrentDictionary<string, System.Windows.Forms.DataVisualization.Charting.Series>();
            chart1.Series.Clear();
        }

        [MethodImpl(MethodImplOptions.Synchronized)]
        public void addPoint(string tag, double x, double y)
        {
            if (!tagToSeriesDict.ContainsKey(tag))
            {
                tagToSeriesDict[tag] = new System.Windows.Forms.DataVisualization.Charting.Series
                {
                    Name = tag,
                    Color = System.Drawing.Color.FromArgb((int)(r.NextDouble() * 255), (int)(r.NextDouble() * 255), (int)(r.NextDouble() * 255)),
                    IsVisibleInLegend = false,
                    IsXValueIndexed = true,
                    ChartType = SeriesChartType.Line
                };

                this.chart1.Series.Add(tagToSeriesDict[tag]);
            }

            tagToSeriesDict[tag].Points.AddXY(x, y);
        }

        protected override void Dispose(bool disposing)
        {
            if (disposing && (components != null))
            {
                components.Dispose();
            }
            base.Dispose(disposing);
        }

        private void InitializeComponent()
        {
            this.components = new System.ComponentModel.Container();
            System.Windows.Forms.DataVisualization.Charting.ChartArea chartArea1 = new System.Windows.Forms.DataVisualization.Charting.ChartArea();
            System.Windows.Forms.DataVisualization.Charting.Legend legend1 = new System.Windows.Forms.DataVisualization.Charting.Legend();
            this.chart1 = new System.Windows.Forms.DataVisualization.Charting.Chart();
            ((System.ComponentModel.ISupportInitialize)(this.chart1)).BeginInit();
            this.SuspendLayout();
            //
            // chart1
            //
            chartArea1.Name = "ChartArea1";
            this.chart1.ChartAreas.Add(chartArea1);
            this.chart1.Dock = System.Windows.Forms.DockStyle.Fill;
            legend1.Name = "Legend1";
            this.chart1.Legends.Add(legend1);
            this.chart1.Location = new System.Drawing.Point(0, 50);
            this.chart1.Name = "chart1";
            // this.chart1.Size = new System.Drawing.Size(284, 212);
            this.chart1.TabIndex = 0;
            this.chart1.Text = "chart1";
            //
            // Form1
            //
            this.AutoScaleDimensions = new System.Drawing.SizeF(6F, 13F);
            this.AutoScaleMode = System.Windows.Forms.AutoScaleMode.Font;
            this.ClientSize = new System.Drawing.Size(800, 600);
            this.Controls.Add(this.chart1);
            this.Name = "Form1";
            this.Text = "Chart";
            this.Load += new System.EventHandler(this.Form1_Load);
            ((System.ComponentModel.ISupportInitialize)(this.chart1)).EndInit();
            this.ResumeLayout(false);
        }
    }
}
编辑:根据要求,我添加了创建表单和调用 addPoint 的代码:
//a static field in the main application:
static ChartForm plot = new ChartForm();

//called once in the constructor of my main application
Application.EnableVisualStyles();
Application.Run(plot); // or whatever

//callback to ObservableConcurrentDictionary called whenever new data comes in:
[MethodImpl(MethodImplOptions.Synchronized)]
    public void onVisibilityChanged(object obj, System.Collections.Specialized.NotifyCollectionChangedEventArgs args)
    {

        KeyValuePair<string, IDistribution> tagAndState = (KeyValuePair<string, IDistribution>)args.NewItems[0];
        string tag = tagAndState.Key;
        double value = (double)tagAndState.Value;


        double now = DateTime.UtcNow.Ticks;
        TicTacToeInteraction.plot.addPoint(tag, now, value);
最佳答案
我已经解决了我自己的问题。
由于数据以不平衡的速率传入,因此数据系列具有不同数量的条目。这会引发异常。因此,我必须设置:
IsXValueIndexed = false,
而不是真实的。
关于c# - "Red X of Doom"在WinForm中绘制多个时间序列图表,我们在Stack Overflow上找到一个类似的问题: https://stackoverflow.com/questions/31414117/