我正在使用 PlotlyJS 来制作图表。然而,我的水平条形图顶部有一些奇怪的填充/边距:
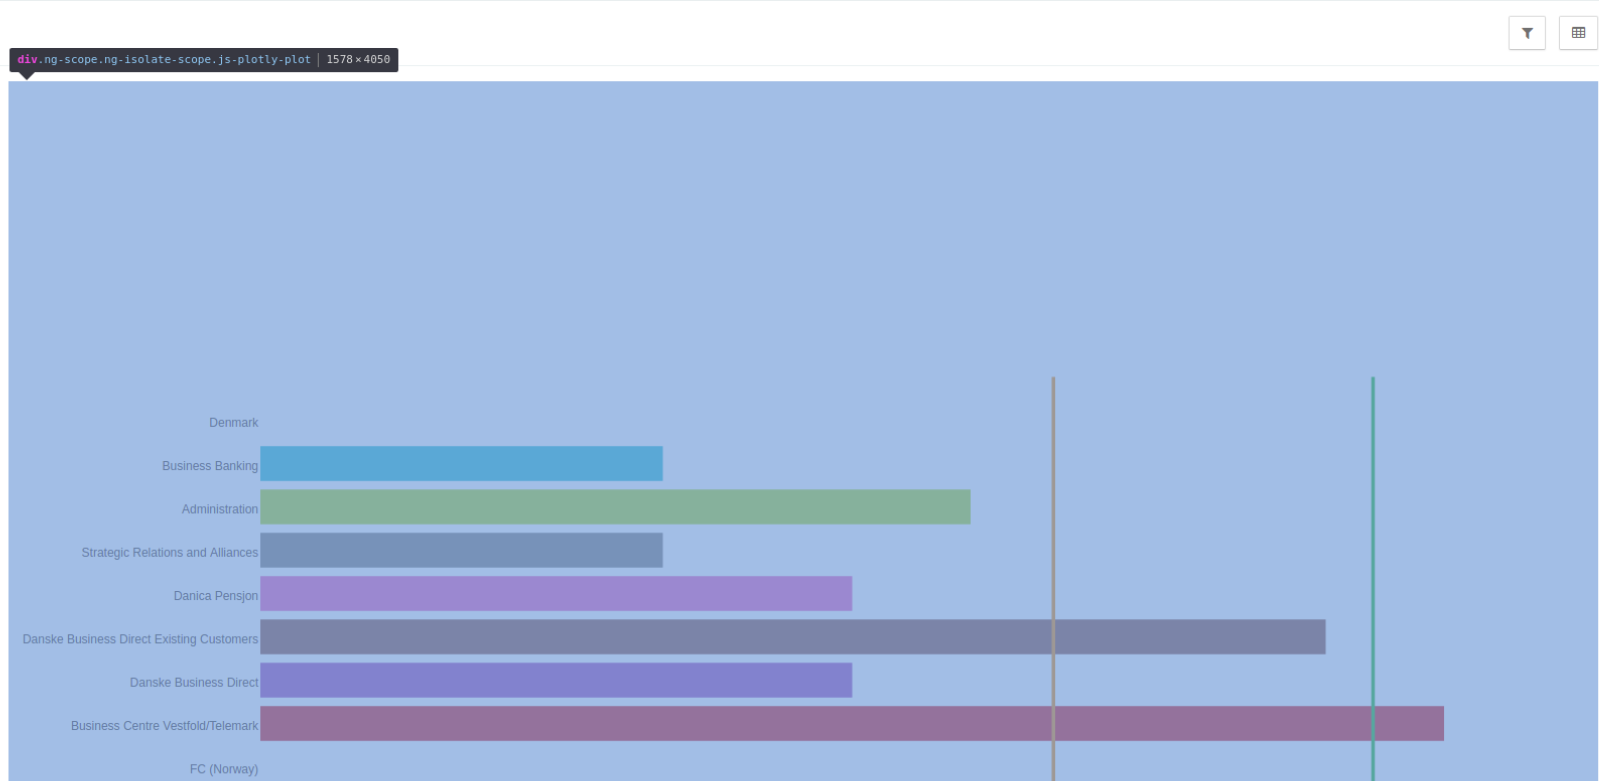
谁能告诉我如何解决这个问题?
代码
    angular.module('Chart').directive('advancedChart', function (seriesGenerator) {
    return {
        restrict: 'E',
        template: '<div> </div>',
        scope: {
            chartData: '=',
            valueKey: '@',
            labelKey: '@',
            orientation: '@',
            seriesType: '@',
            shapes: '=',
            customSeries: '=',
            seriesKey: '@',
            labelFilter: '@',
            labelGroup: '@',
            callback: '=',
            customSize: '='
        },
        replace: true,
        link: function (scope, element, attr) {
            var plotElement = element[0];
            var myPlot = document.getElementById('uniqueId');
            var layout = {};

            if (scope.customSize) {
                var height = scope.chartData.length * 50;
                layout = {
                    height: height
                }
            }

            if (!scope.orientation) {
                scope.orientation = 'v';
            }

            if (!scope.seriesKey) {
                scope.seriesKey = scope.labelKey;
            }

            seriesGenerator.generateAdvancedPlotlySeries(scope.chartData, scope.labelKey, scope.valueKey, scope.seriesType, scope.orientation, scope.seriesKey, scope.labelFilter, scope.labelGroup)
                .then(function (result) {
                    if (scope.shapes) {
                        layout.shapes = scope.shapes;
                    }
                    layout.margin = {
                        l:250,
                    };
                    layout.showlegend = false;

                    if (scope.customSeries) {
                        result = result.concat(scope.customSeries);
                    }

                    createChart(result);
                });

            function createChart(charData) {
                Plotly.newPlot(plotElement, charData, layout);

                plotElement.on('plotly_click', function (data) {
                    if (scope.callback != null) {
                        var returnData = {
                            y: data.points[0].y,
                            x: data.points[0].x
                        };
                        scope.callback(returnData);
                    }
                    console.log('y: ' + data.points[0].y + ' ' + 'x:' + data.points[0].x);
                });
            }

            window.onresize = function () {
                var update = {
                    width: element.parent().width();
                };
                Plotly.relayout(plotElement, update);
            };
        }
    }
});
最佳答案
我没有 Angular 方面的经验,但我认为你应该将 margin-top 值设置为 0。 正如您在引用文献 ( https://plot.ly/javascript/reference/#layout-margin ) 中看到的,layout.margin.t 的默认值为 80。因此,将您的代码更改为:
layout.margin = {
    l:250,
    t:0
};
顺便说一句:也许现在每个绘图顶部的模式栏按钮不再可见。为此,您可以尝试 t:30 或其他值。
希望它有帮助:-)
关于javascript - JS Plotly 奇数边距顶部,我们在Stack Overflow上找到一个类似的问题: https://stackoverflow.com/questions/41548828/