我正在使用http://www.flotcharts.org/库绘制 2 个相连的系列。 我可以成功创建Graph,你可以在下面看到我的JSFIDDLE。
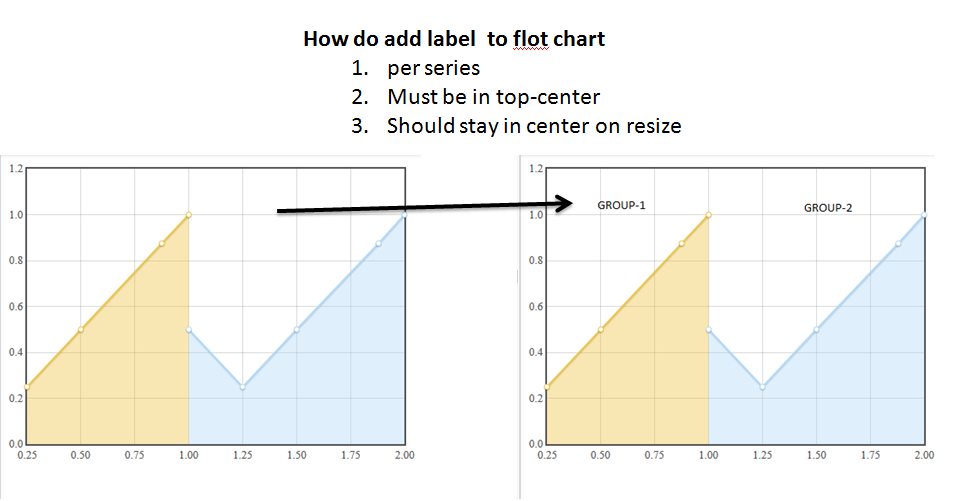
待办事项: 问题是我想在每个系列的顶部中心添加一个标签。 我想以这样的方式添加标签,如果调整图形大小,它会保持在系列的顶部中心。 我怎样才能做到这一点 ?
图像:
JSFIDDLE: http://jsfiddle.net/bababalcksheep/ktZ5X/2/
HTML/CSS:
html, body {height: 100%; }
JS:
var options = {
    series: {
        lines:  { show: true,lineWidth: 2,fill: true},
        points: { show: true,radius: 3,lineWidth: 1},
        shadowSize: 2
    },
    legend: { show: false}
};

var DATA = [{
    "label": "Group-1",
        "data": [
        [0.25, 0.25],
        [0.5, 0.5],
        [0.875, 0.875],
        [1, 1]
    ]
}, {
    "label": "Group-2",
        "data": [
        [1, 0.5],
        [1.25, 0.25],
        [1.5, 0.5],
        [1.88, 0.875],
        [2, 1]
    ]
}];
var plot = $.plot("#placeholder", DATA, options);
最佳答案
我同意 @iLikePrograms 将其添加到 Hook 事件中是最好的方法。这是更新的fiddle .
在您的选项中添加:
hooks: { drawSeries : [addLabel] }
addLabel 函数的位置是:
addLabel = function(plot, ctx, series){
    var xaxis = series.xaxis;
    var yaxis = series.yaxis;
    // space midway on series
    var x = (series.data[series.data.length-1][0] + series.data[0][0])/2;
    // just below top of plot
    var y = yaxis.max - (yaxis.tickSize / 2);
    ctx.font = "16px 'Segoe UI'";
    ctx.fillStyle = "black";
    var text = series.label;
    ctx.fillText(text, xaxis.p2c(x), yaxis.p2c(y)); // add the label
}
关于javascript - jQuery Flot Chart 为每个系列添加标签,我们在Stack Overflow上找到一个类似的问题: https://stackoverflow.com/questions/23832740/