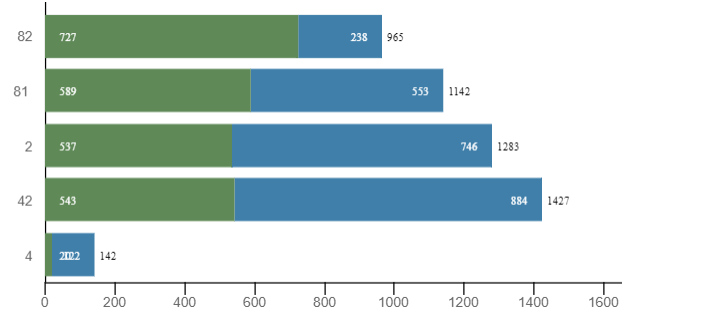
我无法找到删除堆叠水平条形图图形区域中的线的解决方案! ,下面的模型显示了我需要显示 x 和 y 轴线的细节,但目前当我设置 gridLabel:{display:none} 时,每条垂直线都被删除了
  scales: {
    xAxes: [
      {
        ticks: {
          beginAtZero: true,
          fontFamily: "'Open Sans Bold', sans-serif",
          fontSize: 11
        },
        scaleLabel: {
          display: false
        },
      gridLines: {
          display: false,
        },
        ticks: {
          fontFamily: "'Open Sans Bold', sans-serif",
          fontSize: 11
        },
        stacked: true
      }
    ],
    yAxes: [
      {
        gridLines: {
          display: false,
          color: "#fff",
          zeroLineColor: "#fff",
          zeroLineWidth: 0
        },
        ticks: {
          fontFamily: "'Open Sans Bold', sans-serif",
          fontSize: 11
        },
        stacked: true
      }
    ]
},代码笔链接:code link
最佳答案
为 x 轴网格线设置以下属性:
drawOnChartArea: false,
color: "black",
zeroLineColor: "black"
另外,更改 y 轴网格线的颜色:
color: "black"
var barOptions_stacked = {
  tooltips: {
    enabled: false
  },
  hover: {
    animationDuration: 0
  },
  scales: {
    xAxes: [
      {
        ticks: {
          beginAtZero: true,
          fontFamily: "'Open Sans Bold', sans-serif",
          fontSize: 11
        },
        scaleLabel: {
          display: false
        },
        gridLines: {
          drawOnChartArea: false,
          color: "black",
          zeroLineColor: "black"
        },
        stacked: true
      }
    ],
    yAxes: [
      {
        gridLines: {
          display: false,
          color: "black",
          zeroLineColor: "#fff",
          zeroLineWidth: 0
        },
        ticks: {
          fontFamily: "'Open Sans Bold', sans-serif",
          fontSize: 11
        },
        stacked: true
      }
    ]
  },
  legend: {
    display: false
  },

  animation: {
    onComplete: function() {
      var chartInstance = this.chart;
      var ctx = chartInstance.ctx;
      ctx.textAlign = "left";
      ctx.font = "9px Open Sans";
      ctx.fillStyle = "#fff";

      Chart.helpers.each(
        this.data.datasets.forEach(function(dataset, i) {
          var meta = chartInstance.controller.getDatasetMeta(i);
          Chart.helpers.each(
            meta.data.forEach(function(bar, index) {
              data = dataset.data[index];
              if (i == 0) {
                ctx.fillText(data, 50, bar._model.y + 4);
              } else {
                ctx.fillText(data, bar._model.x - 25, bar._model.y + 4);
              }
            }),
            this
          );
        }),
        this
      );
    }
  },
  pointLabelFontFamily: "Quadon Extra Bold",
  scaleFontFamily: "Quadon Extra Bold"
};

var ctx = document.getElementById("Chart1");
var myChart = new Chart(ctx, {
  type: "horizontalBar",
  data: {
    labels: ["82", " 81 ", "2", " 42", "4"],

    datasets: [
      {
        data: [727, 589, 537, 543, 20],
        backgroundColor: "#5f8a58",
        hoverBackgroundColor: "rgba(50,90,100,1)"
      },
      {
        data: [238, 553, 746, 884, 122],
        backgroundColor: "#3f7faa",
        hoverBackgroundColor: "rgba(140,85,100,1)"
      },
      {
        data: [100, 100, 100, 100, 100],
        backgroundColor: "#000",
        hoverBackgroundColor: "rgba(140,85,100,1)"
      }
    ]
  },

  options: barOptions_stacked
});
.graph_container {
display: block;
width: 500px;
}<script src="https://cdnjs.cloudflare.com/ajax/libs/Chart.js/2.1.3/Chart.js"></script>
<div class="graph_container">
<canvas id="Chart1"></canvas>
</div>关于javascript - 在堆叠水平条形图中如何删除 Chart.js 中的垂直线?,我们在Stack Overflow上找到一个类似的问题: https://stackoverflow.com/questions/46261082/