我想使用 ajax 或 json 将数据点添加到我的折线图,现在我必须重新加载整个网页以在图表上显示我的新数据。但我想通过添加如下链接的点来显示实时数据:
www.highcharts.com/studies/live-server.htm
我试图从 mysql 检索我的数据以通过 json 添加到图表上,但没有任何反应。这是我在 live-server-data.php 中的代码:
<?php

header("Content-type: text/json");


 include_once 'include/connection.php';
 $db = new DB_Class();


     $query = "select distinct idchip from datatable ";
     $result = mysql_query( $query );
     $rows = array();
     $count = 0;

     while( $row = mysql_fetch_array( $result ) ) {
         $SQL1 =     "SELECT datetime,temperature FROM `datatable` WHERE idchip=".$row['0']." datetime DESC limit 0,1 ";

        $result1 = mysql_query($SQL1);

        while ($rows = mysql_fetch_array($result1)) {
           $data[] = $rows['1'];
           $datatime[] = 'moment('.$rows['0'].').valueOf()';
        }

        // The x value is the current JavaScript time, which is the Unix time multiplied
        // by 1000.
        $x = $datatime;
        // The y value is a random number
        $y = $data;
     }


// Create a PHP array and echo it as JSON
$ret = array($x, $y);
echo json_encode($ret);
?>
这就是我用来获取数据并在 index.php 页面的图表上显示的内容。
var chart; // global
   /**
     * Request data from the server, add it to the graph and set a timeout to request again
     */
    function requestData() {
        $.ajax({
            url: 'live-server-data.php',
            success: function(point) {
                var series = chart.series[0],
                    shift = series.data.length > 20; // shift if the series is longer than 20

                // add the point
                chart.series[0].addPoint(eval(point), true, shift);

                // call it again after one second
                setTimeout(requestData, 1000);
            },
            cache: false
        });
    }

    $(document).ready(function() {
        chart = new Highcharts.Chart({
            chart: {
                renderTo: 'container',
                defaultSeriesType: 'spline',
                events: {
                    load: requestData
                }
            },
            title: {
                text: 'Live random data'
            },
            xAxis: {
                type: 'datetime',
                tickPixelInterval: 150,
                maxZoom: 20 * 1000
            },
            yAxis: {
                minPadding: 0.2,
                maxPadding: 0.2,
                title: {
                    text: 'Value',
                    margin: 80
                }
            },
            series: [{
                name: 'Random data',
                data: []
            }]
        });
    });
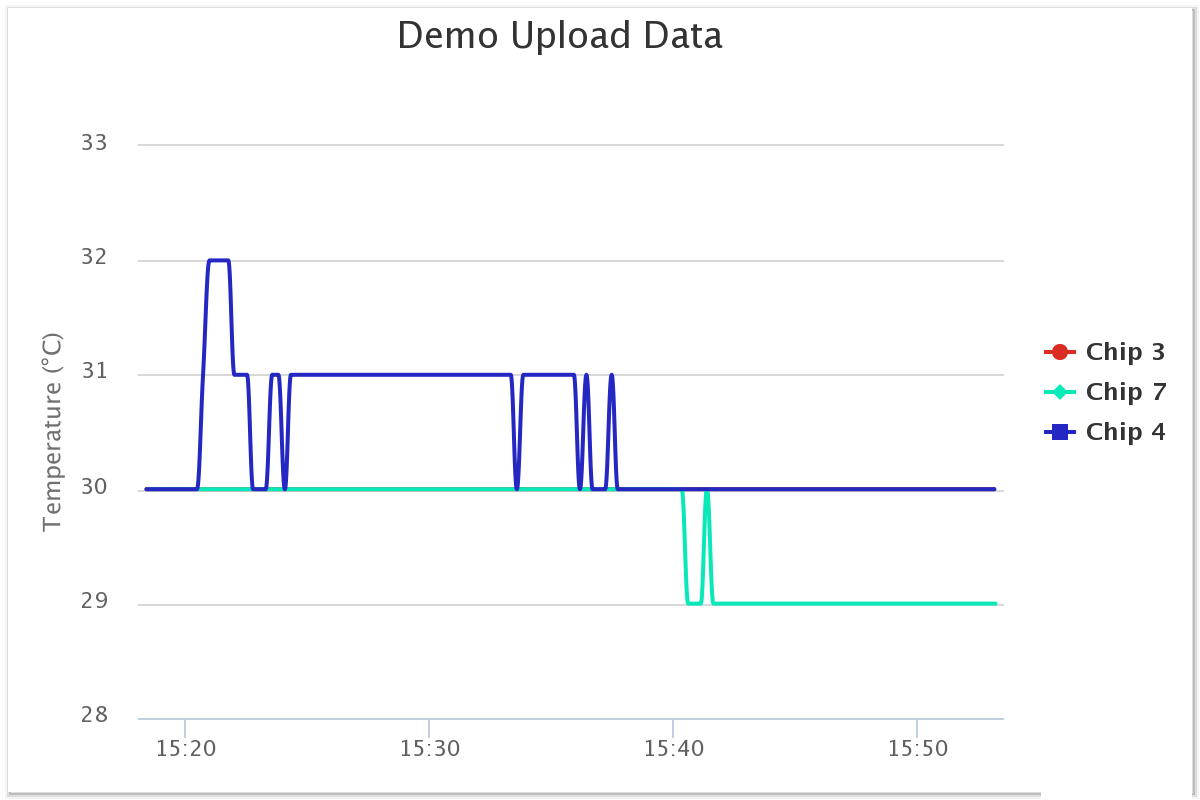
这是我的图表,我现在重新加载页面以获取新数据,但我想“实时”向图表添加新点
最佳答案
我假设您在图表中有多个系列,其中后端每次为每个系列提供一个点。
为了简单起见,我建议您以毫秒为单位返回时间。我的 PHP 不太强,但我想重点很明确
<?php

header("Content-type: text/json");


 include_once 'include/connection.php';
 $db = new DB_Class();


     $query = "select distinct idchip from datatable ";
     $result = mysql_query( $query );
     $rows = array();
     $count = 0;

     while( $row = mysql_fetch_array( $result ) ) {
         $SQL1 =     "SELECT datetime,temperature FROM `datatable` WHERE idchip=".$row['0']." ORDER BY datetime DESC limit 0,1 ";

        $serie = new StdClass;
        $serie->name = $row['0'];
        $result1 = mysql_query($SQL1);

        $points = array();
        while ($rows = mysql_fetch_array($result1)) {
           $points[] = array(strtotime($rows['0']) * 1000, $rows['1']);
        }

        $serie->data = $points;
        $series[] = $serie;
     }


// Create a PHP array and echo it as JSON
$ret = $series;
echo json_encode($ret);
?>
客户端代码为:
var chart;
var chartSeries = {};
var latestTimeReported = {};

function requestData() {

  $.ajax({
    url: 'live-server-data.php',
    success: function(seriesUpdate) {

      //in case initializer of highcharts is too quick - skip the update
      if (!chart) {
        setTimeout(requestData, 1000);
        return;
      }

      $.each(seriesUpdate, function (serieIndex, serieUpdate) {
        var existingSerie = chartSeries[serieUpdate.name];
        var newPoint = serieUpdate.data[0];
        var lastInsertedTime = latestTimeReported[serieUpdate.name];

        if (lastInsertedTime  && lastInsertedTime < newPoint[0]) {
          console.log('Attempt inserting old data!!!!');
          return;
        }

        latestTimeReported[serieUpdate.name] = newPoint[0];

        if (existingSerie) {
          var shift = existingSerie.data.length > 20;
          existingSerie.addPoint(newPoint , true, shift);
        } else {
          var newSerie = chart.addSeries({
            name: serieUpdate.name,
            data: serieUpdate.data
          }, true);
          chartSeries[serieUpdate.name] = newSerie;
        }

      });

      // call it again after one second
      setTimeout(requestData, 1000);
    },
    cache: false
  });
}

$(document).ready(function() {
    chart = new Highcharts.Chart({
        chart: {
            renderTo: 'container',
            defaultSeriesType: 'spline',
            events: {
                load: requestData
            }
        },
        title: {
            text: 'Live random data'
        },
        xAxis: {
            type: 'datetime',
            tickPixelInterval: 150,
            maxZoom: 20 * 1000
        },
        yAxis: {
            minPadding: 0.2,
            maxPadding: 0.2,
            title: {
                text: 'Value',
                margin: 80
            }
        },
        series: []
    });
你可以在这里看到新更新的例子 http://plnkr.co/edit/OqMofEGDadF9J3Uit8qD
关于javascript - 使用 highcharts 从 mysql 数据库向折线图添加动态数据,我们在Stack Overflow上找到一个类似的问题: https://stackoverflow.com/questions/30256040/