我基本上是用 matplotlib 绘制散点图,但是,我用半径改变了每个点。
当我使用 plt.legend() 显示我的图例时,它看起来像这样......
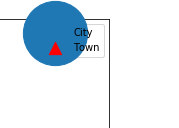
是否有缩小圆的命令。我知道这可能是一个非常微不足道的问题,我已经尝试搜索它了!
最佳答案
解决方案可能取决于图例中的标记是否应与原始大小相比进行缩放,或者是否需要独立于原始大小的恒定标记大小。
A.缩放标记
您可以使用legend.markerscale rcParam .
plt.rcParams["legend.markerscale"] = 0.3
或图例的 markerscale 参数。
plt.legend(markerscale=0.3)
markerscale: None or int or floatThe relative size of legend markers compared with the originally drawn ones. Default is None which will take the value from the legend.markerscale rcParam.
例子:
import matplotlib.pyplot as plt
plt.rcParams["legend.markerscale"] = 0.3

plt.scatter([.3,.5], [.3,.6], s=1000, label="label")
plt.scatter([.7,.4], [.3,.6], s=81, marker="^", label="label2")
plt.legend()
plt.show()

请注意,这将同时缩放所有标记。
B.设置恒定的标记大小
如果您希望图例中的标记大小与散点的实际大小无关,则解决方案会稍微复杂一些。您可以使用图例的 handler_map 将所需的标记大小设置为图例句柄。
import matplotlib.pyplot as plt
from matplotlib.legend_handler import HandlerPathCollection

sc = plt.scatter([.3,.5], [.3,.6], s=1000, label="label")
plt.scatter([.7,.4], [.3,.6], s=[100,300], marker="^", label="label2")

marker_size = 36
def update_prop(handle, orig):
    handle.update_from(orig)
    handle.set_sizes([marker_size])

plt.legend(handler_map={type(sc): HandlerPathCollection(update_func=update_prop)})
plt.show()

关于python - 如何更改图例中散点标记的大小?,我们在Stack Overflow上找到一个类似的问题: https://stackoverflow.com/questions/47115869/