我有一个关于混淆矩阵的问题。
根据混淆矩阵的定义,它用于评估分类器输出的质量。
所以当你将数据拆分为训练集、测试集和验证集时,每个训练集和测试集都会给你一个不同的混淆矩阵。如果我想将它们加在一起,我应该怎么做?
考虑我的以下截图代码:
X, Y = np.array(data[features]), np.array(data['target'])
logo = LeaveOneGroupOut()
group = data['id'].values
k_fold = KFold(n_splits=5)

scores =[]
per_person_true_y = []
per_person_pred_y = []

classifier_logistic = LogisticRegression()
    for train, test in logo.split(X, Y, group):
        x_train, x_test = X[train], X[test]
        y_train, y_test = Y[train], Y[test]
        classifier_logistic.fit(x_train, y_train.ravel())
        y_predict = classifier_logistic.predict(x_test)
        scores.append(metrics.accuracy_score(y_test,classifier_logistic.predict(x_test)))
        per_person_true_y.append(y_test)
        per_person_pred_y.append(y_predict)


plot.confusion_matrix( np.array(per_person_true_y),np.array(per_person_pred_y))
plt.show()
这给了我这个错误:
TypeError: unhashable type: 'numpy.ndarray'
感谢评论。
最佳答案
目前:您有 4 个 NumPy 数组:y_test , y_train , y_test_pred , 和 y_train_pred .
您需要:2 个 NumPy 数组,y_true和 y_pred .
您可以将训练 + 测试与 np.concatenate 结合使用.例如:
y_test = np.array([0, 1, 0, 1])
y_train = np.array([0, 0, 1, 1])

y_test_pred = np.array([1, 1, 0, 1])  # from classifier_logistic.predict(x_test)
y_train_pred = np.array([0, 1, 0, 1]) # from classifier_logistic.predict(x_train)

y_true = np.concatenate((y_train, y_test))  # you already have this as `Y`
y_pred = np.concatenate((y_train_pred, y_test_pred))
有一个 very good example在 sklearn 文档中绘制混淆矩阵。
这是一个考虑到您的情况的示例:
import itertools
import matplotlib.pyplot as plt
import numpy as np
from sklearn.metrics import confusion_matrix
# Source: http://scikit-learn.org/stable/auto_examples/model_selection/
# plot_confusion_matrix.html#confusion-matrix
y_test = np.array([1, 1, 0, 1])
y_train = np.array([0, 0, 1, 1])
y_test_pred = np.array([1, 1, 0, 1]) # from classifier_logistic.predict(x_test)
y_train_pred = np.array([0, 1, 0, 1]) # from classifier_logistic.predict(x_train)
y_true = np.concatenate((y_train, y_test))
y_pred = np.concatenate((y_train_pred, y_test_pred))
def plot_confusion_matrix(cm, classes,
normalize=False,
title='Confusion matrix',
cmap=plt.cm.Blues):
"""
This function prints and plots the confusion matrix.
Normalization can be applied by setting `normalize=True`.
"""
if normalize:
cm = cm.astype('float') / cm.sum(axis=1)[:, np.newaxis]
print("Normalized confusion matrix")
else:
print('Confusion matrix, without normalization')
print(cm)
plt.imshow(cm, interpolation='nearest', cmap=cmap)
plt.title(title)
plt.colorbar()
tick_marks = np.arange(len(classes))
plt.xticks(tick_marks, classes, rotation=45)
plt.yticks(tick_marks, classes)
fmt = '.2f' if normalize else 'd'
thresh = cm.max() / 2.
for i, j in itertools.product(range(cm.shape[0]), range(cm.shape[1])):
plt.text(j, i, format(cm[i, j], fmt),
horizontalalignment="center",
color="white" if cm[i, j] > thresh else "black")
plt.tight_layout()
plt.ylabel('True label')
plt.xlabel('Predicted label')
cm = confusion_matrix(y_true, y_pred)
np.set_printoptions(precision=2)
plt.figure()
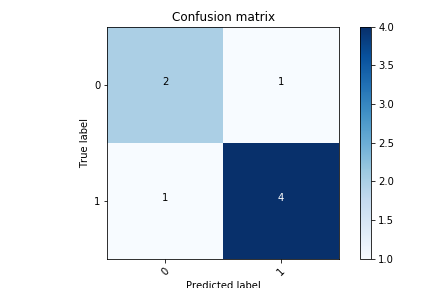
plot_confusion_matrix(cm, classes=[0, 1],
title='Confusion matrix')
关于python - sklearn : Plot confusion matrix combined across training+test sets,我们在Stack Overflow上找到一个类似的问题: https://stackoverflow.com/questions/48817300/