我如何绘制一些数据,删除由该数据创建的轴,并用不同比例的轴替换它们?
假设我有这样的东西:
import matplotlib.pyplot as plt

fig = plt.figure()
ax = fig.add_subplot(111)
plt.xlim([0,5])
plt.ylim([0,5])
plt.plot([0,1,2,3,4,5])
plt.show()
这会在 5x5 图中绘制一条线,两个轴上的范围都从 0 到 5。我想删除 0 到 5 轴并说用 -25 到 25 轴替换它。这只会改变轴,但我不想移动任何数据,即它看起来与原始图相同,只是轴不同。我意识到这可以简单地通过移动数据来完成,但我不想更改数据。
最佳答案
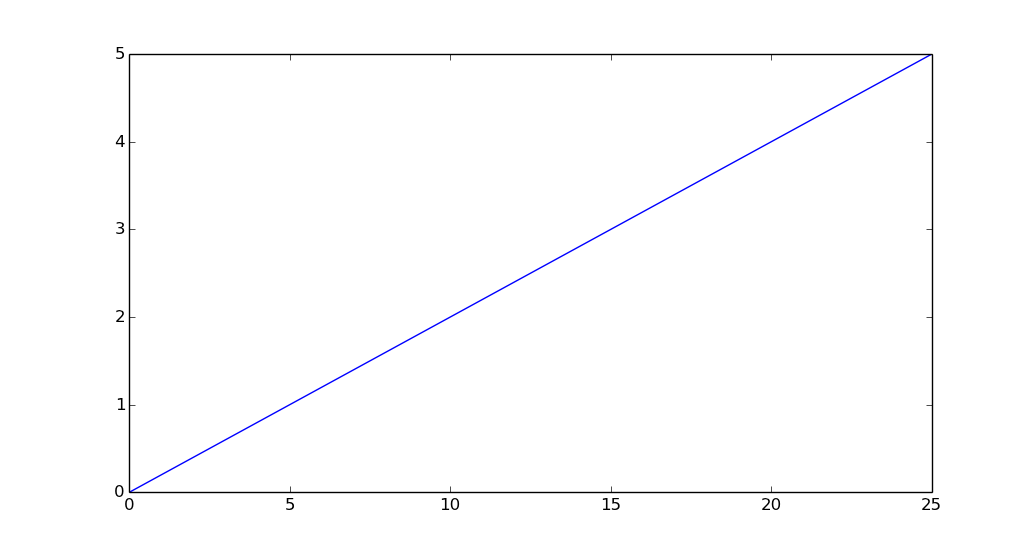
您可以使用 plt.xticks 找到标签的位置,然后将标签设置为位置值的 5 倍。底层数据不变;只有标签。
import matplotlib.pyplot as plt

fig = plt.figure()
ax = fig.add_subplot(111)
plt.xlim([0,5])
plt.ylim([0,5])
plt.plot([0,1,2,3,4,5])
locs, labels = plt.xticks()
labels = [float(item)*5 for item in locs]
plt.xticks(locs, labels)
plt.show()
产量
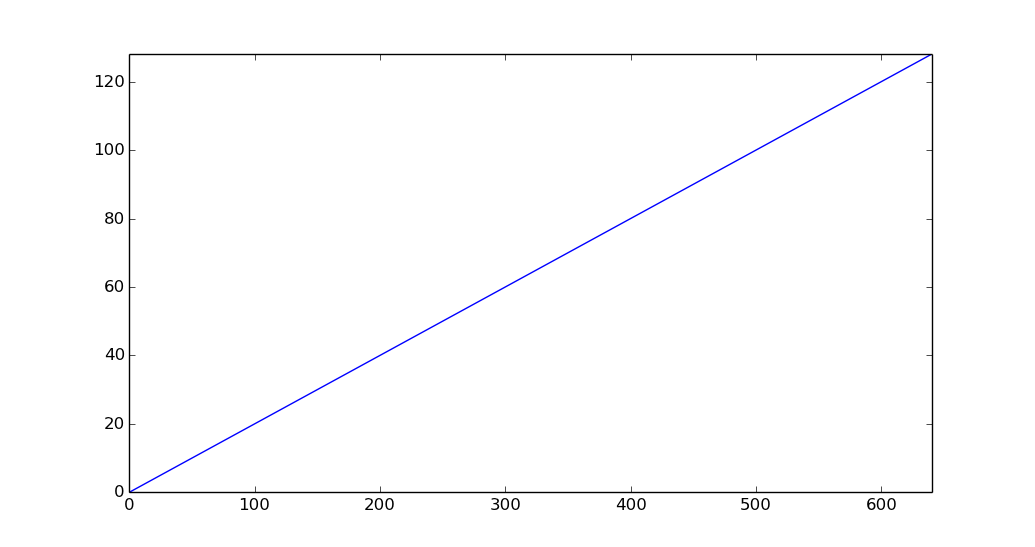
或者,您可以更改代码格式器:
import matplotlib.pyplot as plt
import matplotlib.ticker as ticker

N = 128
fig = plt.figure()
ax = fig.add_subplot(111)
plt.plot(range(N+1))
plt.xlim([0,N])
plt.ylim([0,N])
ax.xaxis.set_major_formatter(ticker.FuncFormatter(lambda x, pos: ('%g') % (x * 5.0)))
plt.show()
关于python - 在不更改数据的情况下更改轴(Python),我们在Stack Overflow上找到一个类似的问题: https://stackoverflow.com/questions/23965223/