我正在尝试用阈值前后的彩色标记绘制图表。如果我使用 for 循环 for 读取随时间 H:M 解析输入文件,我只能绘制和着色两个点。但是对于我无法绘制的所有要点。
输入
akdj 12:00 34515 sdfg
sgqv 13:00 34626 ssfgb
dfbb 13:00 14215 gghgws
ajdf 13:30 14224 gdgva
dsfb 13:45 25672 FW
sfhh 14:00 85597 adsfb
程序
# ma masked array
import csv
import datetime as dt
import numpy as np
import matplotlib.pyplot as plt
from matplotlib.pyplot import  plot

threshold = 30000
x,y = [],[]
csv_reader = csv.reader(open('Count_Time.csv'))

for line in csv_reader:
    y.append(int(line[2]))
    x.append(dt.datetime.strptime(line[1],'%H:%M'))

#plt.figure()

plt.plot(x,y, color='blue')

#Add below threshold markers
below_threshold = y < threshold
plt.scatter(x[below_threshold], y[below_threshold], color='green')

# Add above threshold markers
above_threshold = np.logical_not(below_threshold)
plt.scatter(x[above_threshold], y[above_threshold], color='red')


plt.show()
错误的输出

当我使用下面的代码读取没有显示任何错误但显示空白图形布局的文件时。
data = np.genfromtxt('Count_Time.csv', delimiter=",")
x = data[:,1]
y = data[:,2]
以这种方式更改时会显示以下错误
data = np.loadtxt('Count_Time.csv', delimiter=',', dtype='str, time, int, str')
x = data[:,1]
y = data[:,2]
错误
 data = np.loadtxt('Count_Time.csv', delimiter=',', dtype='str, time, int, str')
  File "/usr/lib/python2.7/dist-packages/numpy/lib/npyio.py", line 798, in loadtxt
    dtype = np.dtype(dtype)
TypeError: data type "time" not understood
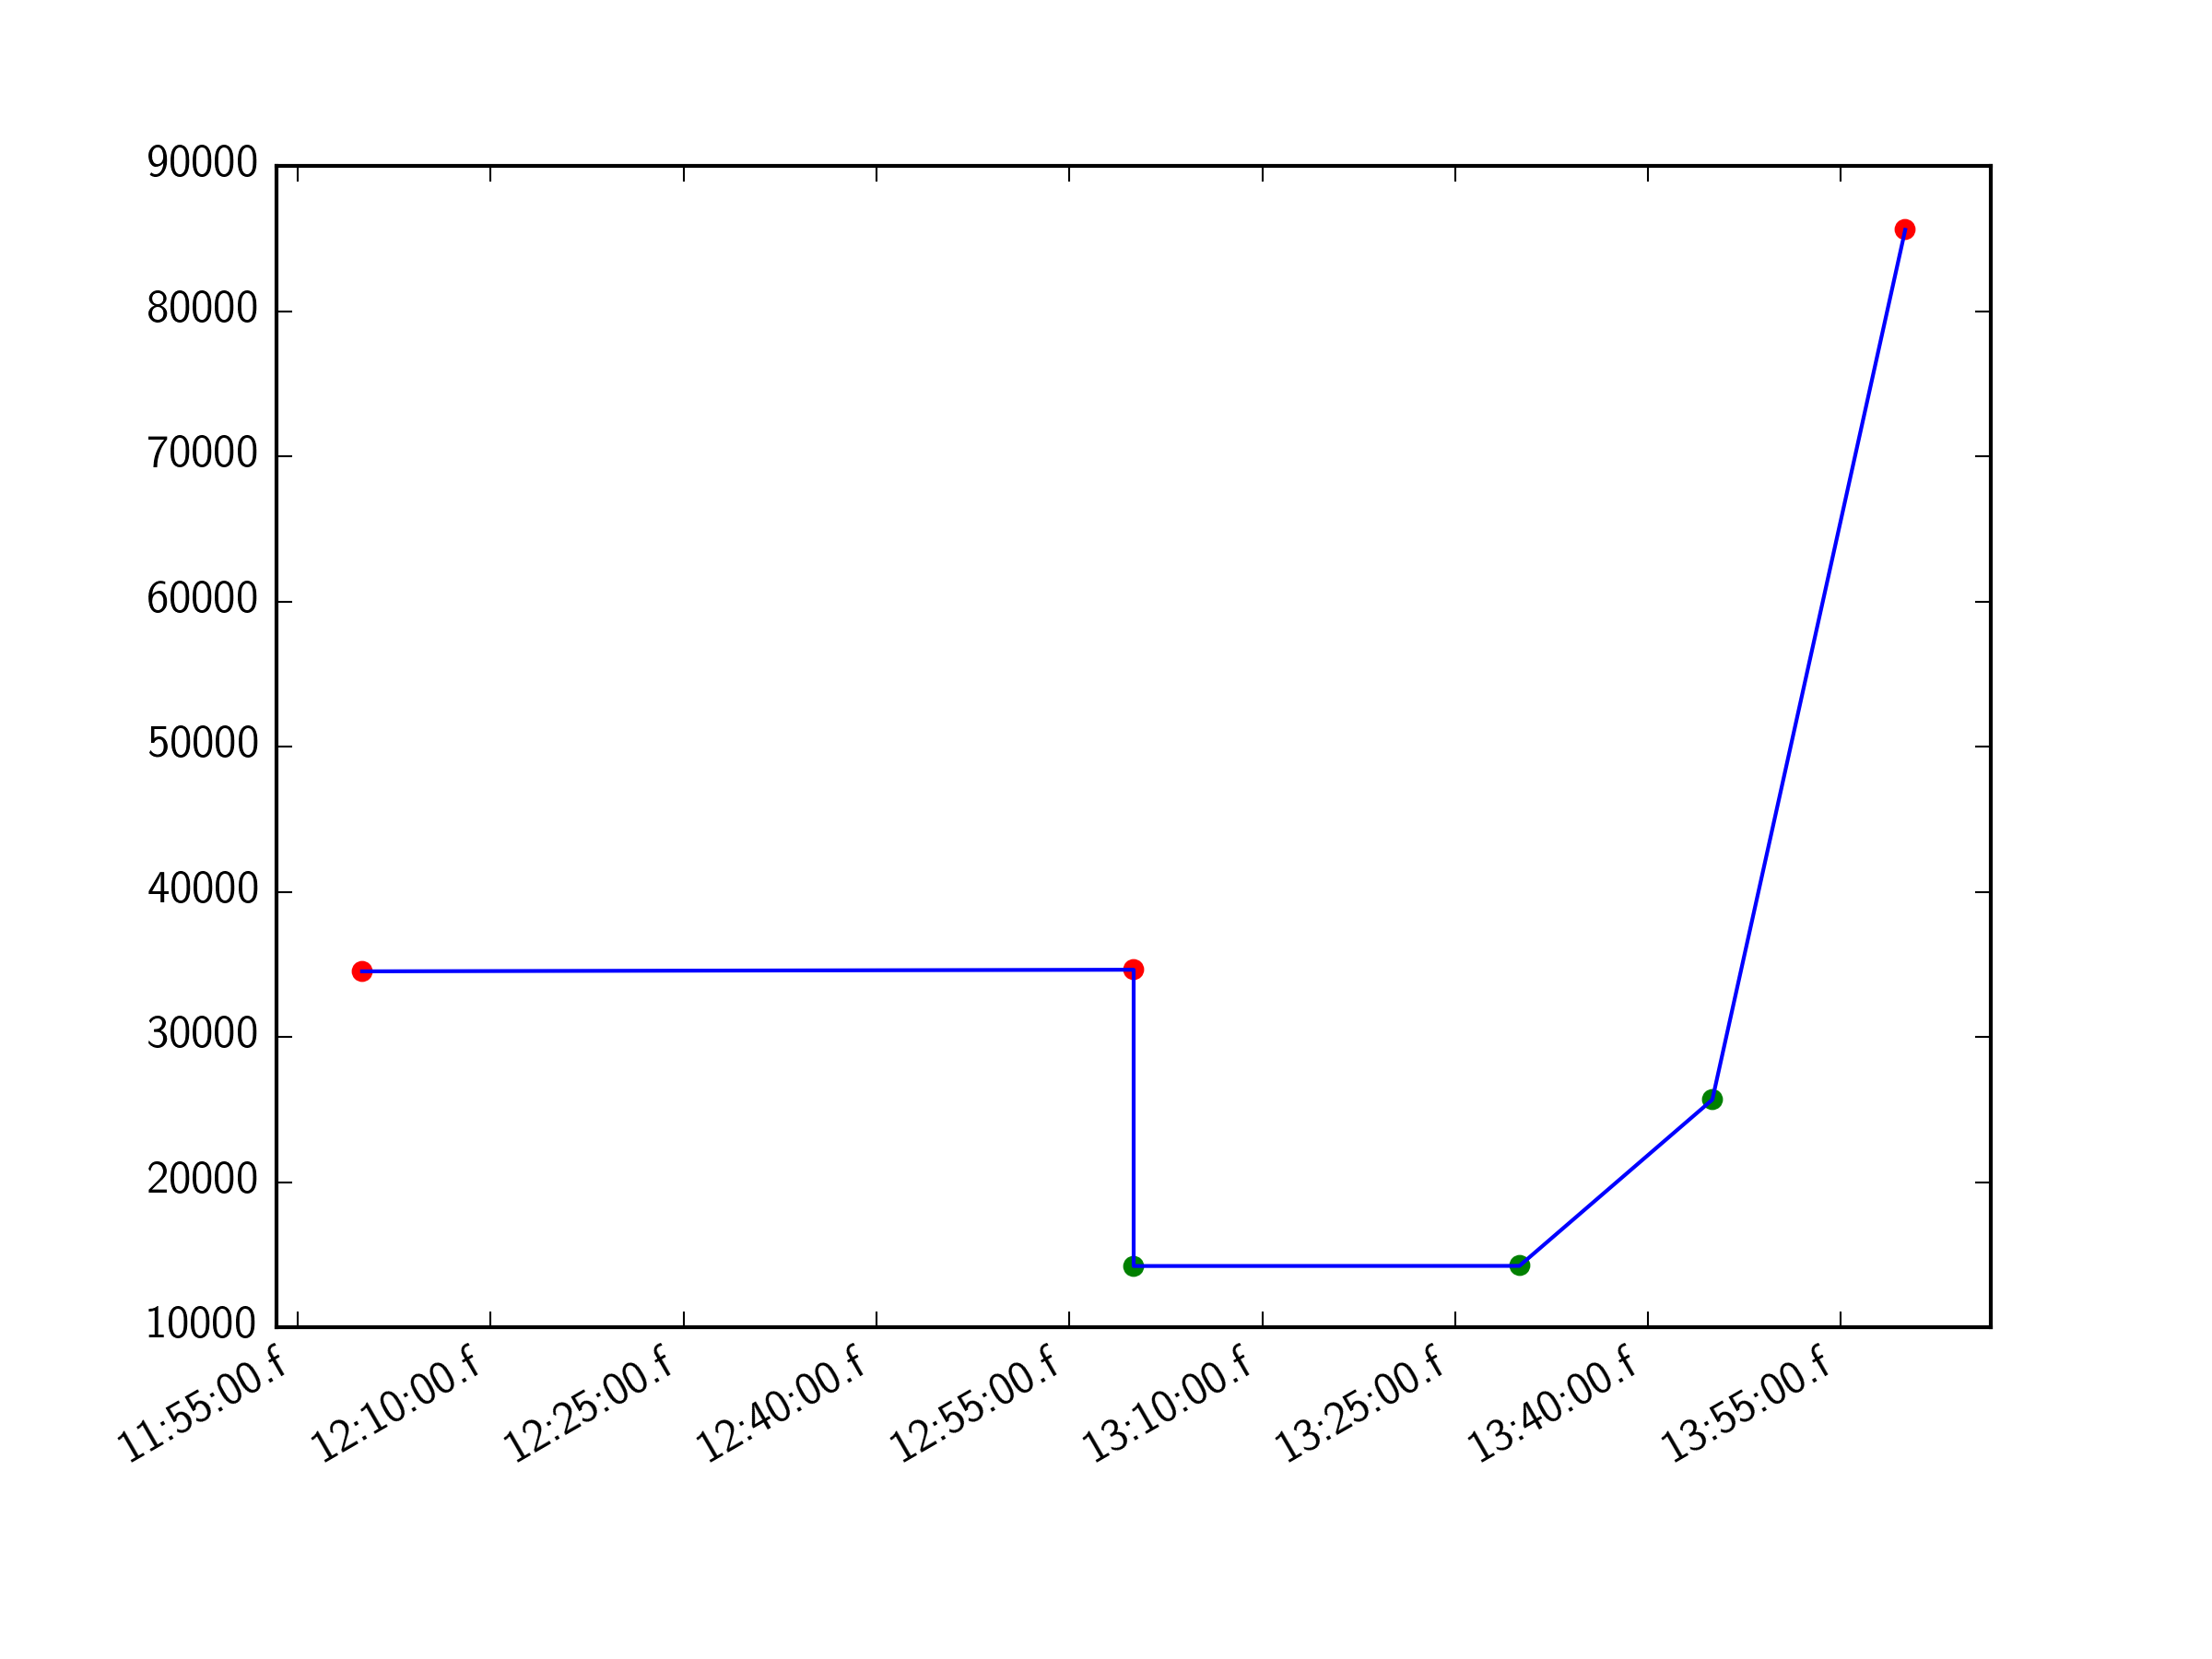
最佳答案
在计算above_threshold 和below_threshold,然后就可以了。在您的版本中,您没有得到 bool 数组,而只有 False 和 True。
我在您的输入 csv 文件中添加了逗号分隔符以使其工作(我假设应该首先出现?)
import csv
import datetime as dt
import numpy as np
import matplotlib.pyplot as plt
from matplotlib.pyplot import  plot

threshold = 30000
x,y = [],[]
csv_reader = csv.reader(open('input.csv'))

for line in csv_reader:
    y.append(int(line[2]))
    x.append(dt.datetime.strptime(line[1],'%H:%M'))

fig=plt.figure()

below_threshold = y < threshold
above_threshold = np.logical_not(below_threshold)

print below_threshold
# False

print above_threshold
# True

x=np.array(x)
y=np.array(y)

plt.plot(x,y, color='blue')

#Add below threshold markers
below_threshold = y < threshold
print below_threshold
# [False False  True  True  True False]

plt.scatter(x[below_threshold], y[below_threshold], color='green')

# Add above threshold markers
above_threshold = np.logical_not(below_threshold)
print above_threshold
# [ True  True False False False  True]

plt.scatter(x[above_threshold], y[above_threshold], color='red')

fig.autofmt_xdate()

plt.show()
关于python - 读取 CSV 并绘制彩色折线图,我们在Stack Overflow上找到一个类似的问题: https://stackoverflow.com/questions/30841038/