对于我的研究报告,我编写了一个自定义模块,其中包含 2 个用于为我的报告制作图像的函数:
process_mods.py:
def make_image(image, filename, color_map, title):
    '''
    Take as arguments an array, the filename to save as, a color map, and
    a title for the image.
    Produces a publication-quality image of the array, rescaled to Galactic
    coordinates.
    '''
    l_max = 25
    b_max = 15
    xlabel = r'Galactic longitude $\ell$ (deg)'
    ylabel = r'Galactic latitude $b$ (deg)'
    plt.imshow(image, origin='lower',
          extent=[l_max, -l_max, -b_max, b_max],
          cmap = color_map)
    plt.title(title, fontsize = 'small')
    plt.xlabel(xlabel, fontsize = 'small')
    plt.ylabel(ylabel, fontsize = 'small')
    plt.savefig(filename + '.png',
                transparent=False,
                bbox_inches='tight',
                overwrite = True)

def make_image_colorbar(image, filename, color_map, title):
    '''
    Take as arguments an array, the filename to save as, a color map, and
    a title for the image.
    Produces a publication-quality image of the array, rescaled to Galactic
    coordinates, including color bar.
    '''
    l_max = 25
    b_max = 15
    xlabel = r'Galactic longitude $\ell$ (deg)'
    ylabel = r'Galactic latitude $b$ (deg)'
    ax = plt.subplot(111)
    fig =ax.imshow(image, origin='lower',
          extent=[l_max, -l_max, -b_max, b_max],
          cmap = color_map)
    plt.colorbar(fig, fraction = 0.028)
    plt.title(title, fontsize = 'small')
    plt.xlabel(xlabel, fontsize = 'small')
    plt.ylabel(ylabel, fontsize = 'small')
    plt.savefig(filename + '.png',
                transparent=False,
                bbox_inches='tight',
                overwrite = True)
make_image 函数按预期工作,而 make_image_colorbar 的想法只是在图像中包含一个颜色条。
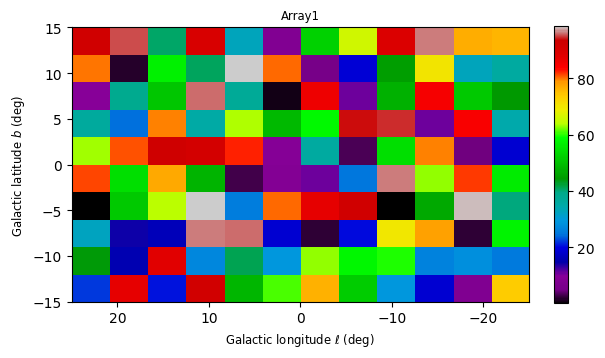
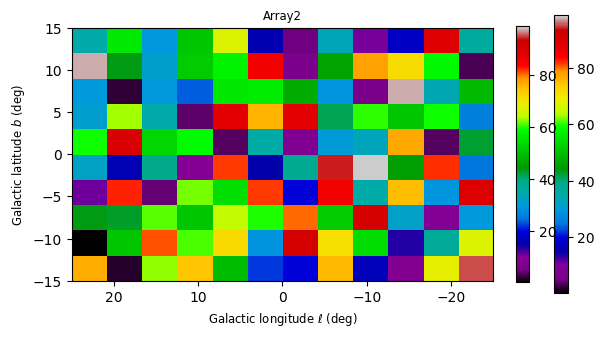
当我在两个连续的数组上调用 make_image_colorbar 函数时,第一个看起来不错,但第二个有两个颜色条,一个是它自己的,一个来自第一个图像。这是我用来测试模块的代码:
import process_mods as pm

arr1 = pm.create_random_array(0, 100, 10, 12, 5)
arr2 = pm.create_random_array(0, 100, 10, 12, 10)

pm.make_image(arr1, 'arr1', 'spectral', 'Array1')
pm.make_image_colorbar(arr2, 'arr2', 'spectral', 'Array2')
这个测试利用了
def create_random_array(low, high, height, width, seed):
    '''
    Create a random array of floats from lower_limit to upper_limit
    in a height x width matrix
    '''
    np.random.seed(seed)
    random_array = high * np.random.rand(height, width) + low
    return random_array
这是 process_mods 的另一个函数,但我认为这不是问题所在。
谁能看到我如何阻止函数在 arr2 上打印 arr1 的颜色条?
最佳答案
我认为混淆来自于没有意识到你在绘制什么图形/轴。我发现使用 matplotlib 的面向对象界面可以让您更清楚地知道您正在使用哪些轴。
我对您的代码所做的更改是在您的主脚本中创建图形,并在调用 process_mode.py 中定义的函数时将它们作为参数传递。这样你就可以确定你在哪里绘图。此外,您可以将 ax 参数传递给 plt.colorbar() 以指定它适用于哪些轴:
plt.colorbar(im, ax=ax)
process_mods.py 中的 make_image_colorbar 将变为:
def make_image_colorbar(image, fig, ax, filename, color_map, title):

    l_max = 25
    b_max = 15
    xlabel = r'Galactic longitude $\ell$ (deg)'
    ylabel = r'Galactic latitude $b$ (deg)'

    im = ax.imshow(image, origin='lower',
          extent=[l_max, -l_max, -b_max, b_max],
          cmap = color_map)
    fig.colorbar(im, fraction = 0.028, ax = ax)

    ax.set_title(title, fontsize = 'small')
    ax.set_xlabel(xlabel, fontsize = 'small')
    ax.set_ylabel(ylabel, fontsize = 'small')
    fig.savefig(filename + '.png',
                transparent=False,
                bbox_inches='tight',
                overwrite = True)
注意:我删除了文档字符串只是为了让这个答案更容易阅读
您可以(并且可能应该保持一致)对make_image
您的主要功能将如下所示。
import process_mods as pm
arr1 = pm.create_random_array(0, 100, 10, 12, 5)
arr2 = pm.create_random_array(0, 100, 10, 12, 10)
fig1, ax1 = plt.subplots()
fig2, ax2 = plt.subplots()
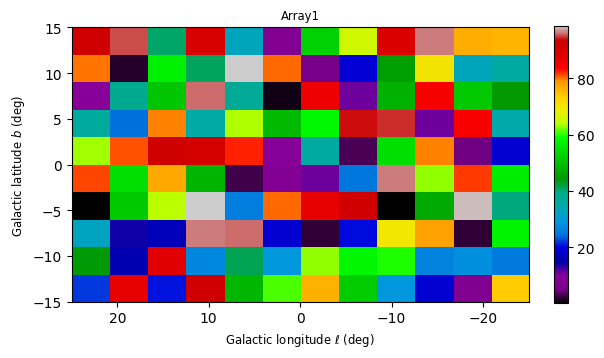
pm.make_image_colorbar(arr1, fig1, ax1, 'arr1', 'spectral', 'Array1')
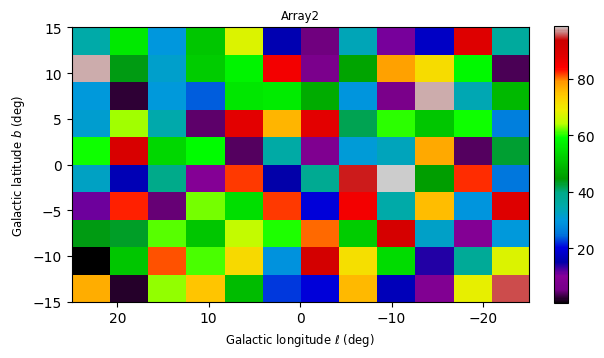
pm.make_image_colorbar(arr2, fig2, ax2, 'arr2', 'spectral', 'Array2')
plt.show()
给出:
关于python - 在函数中使用颜色条,我们在Stack Overflow上找到一个类似的问题: https://stackoverflow.com/questions/46922176/