我正在尝试绘制一个圆和其中一组随机分布的点。 AFAIK,可以向 ax 对象添加任意数量的数字。所以,这是我的方法:
import numpy as np
import matplotlib.pyplot as plt

x = np.random.uniform(1,5,size=1000)
theta = np.random.uniform(0.55*np.pi,1.2*np.pi,size=1000)
y = [i*np.tan(j) for i,j in zip(x,theta)]

xx = np.random.uniform(0,1,size=1000)
yy = np.random.uniform(0,1,size=1000)

for i in range(len(xx)):
    if xx[i]>yy[i]:
        xx[i],yy[i] = yy[i],xx[i]

R = 5

xxx = [j*R*np.cos(2*np.pi*i/j) for i,j in zip(xx,yy)]
yyy = [j*R*np.sin(2*np.pi*i/j) for i,j in zip(xx,yy)]

circle = plt.Circle((0, 0), 5, color='b', fill=False)
scatt = plt.scatter(yyy,xxx)

fig, ax = plt.subplots()

ax.add_artist(circle)
ax.add_artist(scatt)

plt.ylabel("scatter")
plt.xlabel("Data")

plt.show()
但是解释器返回以下错误:
ValueError: Can not reset the axes. You are probably trying to re-use an artist in more than one Axes which is not supported
我犯了什么愚蠢的错误?!
最佳答案
import numpy as np
import matplotlib.pyplot as plt
import matplotlib as mpl

x = np.random.uniform(1,5,size=1000)
theta = np.random.uniform(0.55*np.pi,1.2*np.pi,size=1000)
y = [i*np.tan(j) for i,j in zip(x,theta)]

xx = np.random.uniform(0,1,size=1000)
yy = np.random.uniform(0,1,size=1000)

for i in range(len(xx)):
    if xx[i]>yy[i]:
        xx[i],yy[i] = yy[i],xx[i]

R = 5

xxx = [j*R*np.cos(2*np.pi*i/j) for i,j in zip(xx,yy)]
yyy = [j*R*np.sin(2*np.pi*i/j) for i,j in zip(xx,yy)]

#circle = plt.Circle((0, 0), 5, color='b', fill=False)
#scatt = plt.scatter(yyy,xxx)

fig, ax = plt.subplots()

#ax.add_artist(circle)
#ax.add_artist(scatt)

ax.scatter(yyy,xxx)
ax.add_patch(mpl.patches.Circle((0, 0), 5, color='b', fill=False))

plt.ylabel("scatter")
plt.xlabel("Data")

plt.axis('equal')       # Added, optional :)

plt.show()
生产
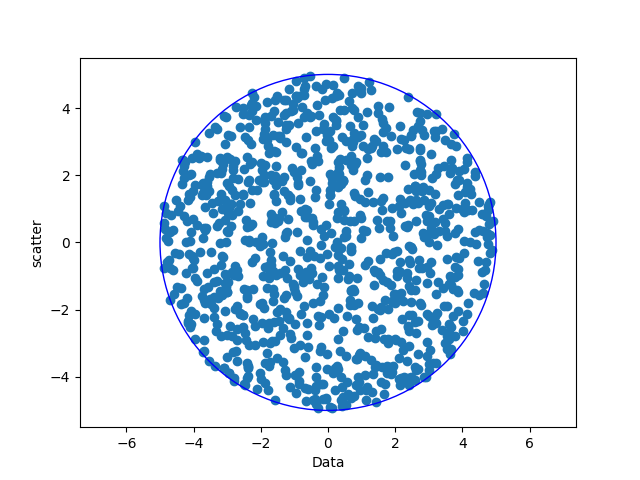
唯一的区别是我创建了一个轴对象(通过 plt.subplots()),称为轴方法 ax.scatter()和 ax.add_patch(Circle(...))在上面画画。
我的猜测是您调用的 plt.__ 方法正在创建它们自己的独立轴,然后您尝试将它们与 add_artist “合并”导致错误.
关于python - 无法重置轴,我们在Stack Overflow上找到一个类似的问题: https://stackoverflow.com/questions/50753721/