我需要在 python 中的图像上绘制一般坐标网格。我可以计算网格线的像素坐标,因此我只需要一个能够将它们绘制为图像顶部的虚线 的模块。图像以 numpy 数组的形式出现,因此我需要能够在这些格式和绘图库使用的图像格式之间进行转换(一个方向就足够了 - 我可以绘制网格和将其导出到 numpy,或导入 numpy 数组并在其上绘制)。它还需要相当快。
这是我尝试过的:
魔杖
最近支持绘制虚线,并且与 numpy 兼容:
with Drawing() as draw:
    draw.stroke_antialias = False
    draw.stroke_dash_array = [1,3]
    draw.stroke_color = Color("gray")
    draw.fill_opacity = 0
    points = calc_grid_points()
    draw.polyline(points)
    with Image(width=width, height=height) as img:
        draw(img)
        return np.fromstring(img.make_blob("RGBA"),np.uint8).reshape(img.height, img.width, 4)
但是,使用此库在 2000x1000 的图像上绘制几百条虚线需要 30 秒!几乎所有时间都花在了 draw(img) 上。所以除非我在这里做错了什么,否则魔杖太慢了。
PIL
Python 图像库一般工作正常,但它似乎不支持虚线。我没有看到有人直接说出来,但是谷歌搜索只会产生 2-3 个人询问它并且没有得到任何答案。非虚线坐标网格看起来不太好,并且覆盖了大部分正在绘制的图像。 PIL 比 wand 快多。这个没有破折号但与上面的魔杖版本等效的版本只需要 0.06 开始画画。这比魔杖快 450 倍!
    img  = PIL.Image.new("RGBA", (width, height))
    draw = PIL.ImageDraw.Draw(img)
    segs = calc_grid_points()
    for seg in segs:
        draw.line([tuple(i) for i in seg], fill=(0,0,0,32))
    return np.array(img)
广东
gd 支持虚线,但我没有找到将其图像与 numpy 数组相互转换的有效方法。
Matplotlib
Matplotlib 对绘制坐标网格和坐标轴有适当的支持,但遗憾的是似乎无法避免重新像素化。它坚持构建其新的像素集,这些像素从不与原始像素进行一对一映射。这对于平滑的图像来说很好,但对于像素与像素之间变化很大的图像来说就不行了。
这是一个 matplotlib 再像素化的例子:
import numpy as np
import matplotlib
matplotlib.use("Agg")
import matplotlib.pyplot as plt
n = 1001
data = np.arange(n*n).reshape(n,n)%2
plt.imshow(data)
plt.savefig("test.png")
这张图片包含一个棋盘图案,每个像素在 0 和 1 之间切换。但据我所知,没有办法确保一个像素的数据将恰好对应于输出中的一个像素。如果没有,您会得到莫尔图案,就像这段代码产生的那样:
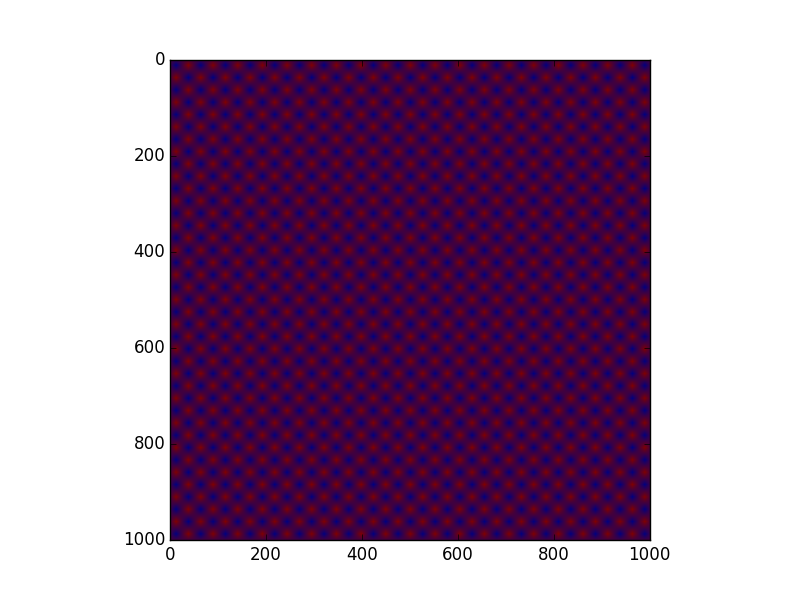
手动调整 dpi 设置可以减少这个问题,但不能消除它。正确的输出会使绘图的数据部分恰好占据 1001 x 1001 像素(因此整个图像会比这大),并在每个方向上重复显示 500 次图案。
编辑:添加 interpolation='none' 没有帮助。这只会导致 matplotlib 使用最近的邻居。它仍然没有显示所有数据。输出结果如下:

这是正确的输出结果(我将其裁剪为 500x500,完整版为 1001x1001):

但 matplotlib 并不是我真正的问题 - 它只是用 python 在图像上绘制虚线。 Matplotlib 只是一种可行的方法。
备选方案?
所以我想知道,还有其他图像库可以实现这一目标吗?还是我忽略了上述使它们可用的功能?
最佳答案
使用 matplotlib,在删除帧和刻度线后,使用 dpi 似乎可以得到不错的结果。
但是有一点是边界框计算遇到了舍入错误,因此我们需要手动修复边界框大小:
import numpy as np
import matplotlib
import matplotlib.pyplot as plt

# Some fake data
n = 1001
data = np.arange(n*n).reshape(n,n)%2
data = data[:n//2,:]

def get_bitmap_frame(data, dpi=None):
    """
    Construct a figure for overlaying elements on top of bitmap data.

    Returns
    -------
    fig, ax
        Matplotlib figure and axis objects
    """
    if dpi is None:
        dpi = matplotlib.rcParams['savefig.dpi']
    dpi = float(dpi)

    fig = plt.figure(figsize=(data.shape[1]/dpi, data.shape[0]/dpi), dpi=dpi)
    ax = fig.add_axes([0, 0, 1, 1], frame_on=False)
    ax.xaxis.set_visible(False)
    ax.yaxis.set_visible(False)
    ax.imshow(data, interpolation='none')

    # Note: it can happen that floating point rounding error in
    # bbox calculation results to the bbox size being off by one
    # pixel. Because of this, we set it manually
    fig.bbox = matplotlib.transforms.Bbox.from_bounds(0, 0, data.shape[1], data.shape[0])
    return fig, ax

fig, ax = get_bitmap_frame(data)

# Annotate
ax.text(100, 100, 'Hello!', color='w')

fig.savefig("test.png")
关于python - 兼容 Numpy 的图像绘图库,我们在Stack Overflow上找到一个类似的问题: https://stackoverflow.com/questions/28647383/