我是计算机视觉的新手,这是我的第一份作业。我正在尝试创建与文件夹中的每个图像相对应的 rgb 直方图。假设我在 test 文件夹(位于我当前的工作目录中)中有 10 张图片。我想为每个图像创建 10 个直方图。我写了以下脚本:
import os
import cv2
import numpy as np
from matplotlib import pyplot as plt
import pylab
images = []
for image in os.listdir("./test/"):
    images.append(image)
color = ('b','g','r')
for image in images:
    img = cv2.imread(image)
    for i, col in enumerate(color):
        hist = cv2.calcHist([img], [i], None, [256], [0,256])
        plt.plot(hist, color = col)
        plt.xlim([0,256])
        pylab.savefig(image)
当我运行脚本时出现以下错误:
OpenCV Error: Assertion failed (j < nimages) in histPrepareImages, file /../../OpenCV/opencv-2.4.13/modules/imgproc/src/histogram.cpp, line 148
Traceback (most recent call last):
File "foo.py", line 23, in <module>
hist = cv2.calcHist([img], [i], None, [256], [0,256])
cv2.error: /../../OpenCV/opencv-2.4.13/modules/imgproc/src/histogram.cpp:148: error: (-215) j < nimages in function histPrepareImages
你能告诉我这里是否遗漏了什么吗?
最佳答案
对上面的代码进行了一些小的修改,我在 test 文件夹中绘制了 2 个虚拟图像的直方图。
import matplotlib.pyplot as plt
import cv2
import os

images = []
path = "../Mission Begins/test/"
for image in os.listdir(path):
    images.append(image)

for image in images:
     img = cv2.imread("%s%s"%(path, image))    # Load the image
     channels = cv2.split(img)       # Set the image channels
     colors = ("b", "g", "r")        # Initialize tuple
     plt.figure()
     plt.title("Color Histogram")
     plt.xlabel("Bins")
     plt.ylabel("Number of Pixels")

     for (i, col) in zip(channels, colors):       # Loop over the image channels
          hist = cv2.calcHist([i], [0], None, [256], [0, 256])   # Create a histogram for current channel
          plt.plot(hist, color = col)      # Plot the histogram
          plt.xlim([0, 256])
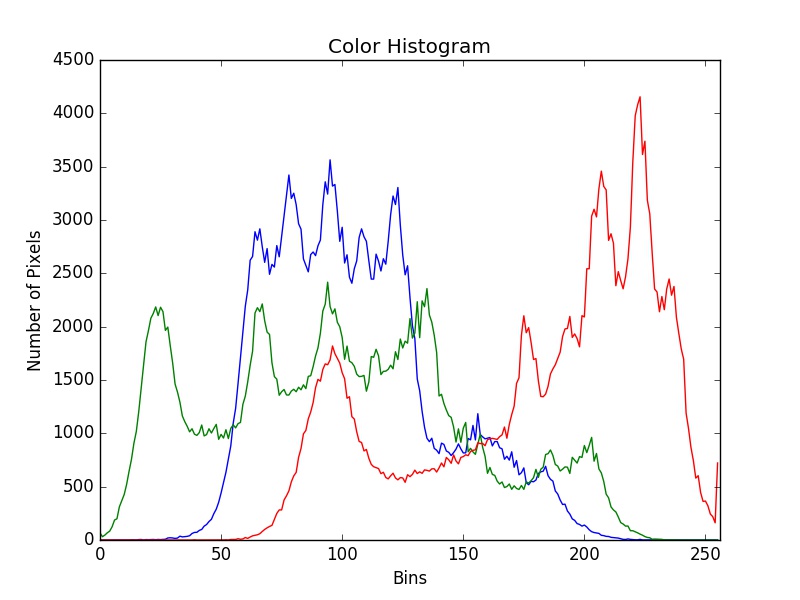
输入图片

直方图
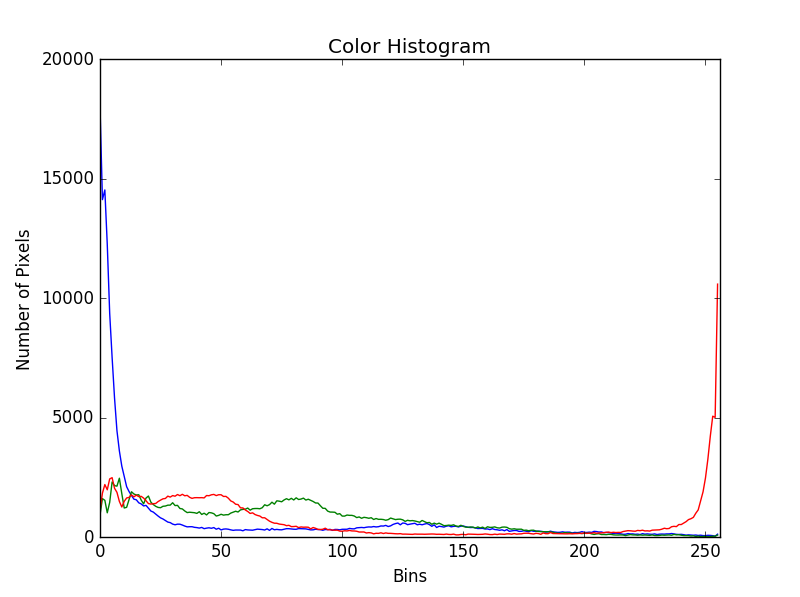
输入图片
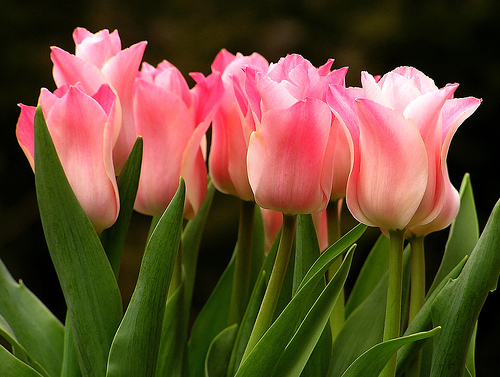
直方图
关于python - 在 python 中使用 cv2.calcHist 获取目录中多个图像的颜色直方图,我们在Stack Overflow上找到一个类似的问题: https://stackoverflow.com/questions/37388671/