以下是我的插值的输入:
x = [-1.01, 5.66, 5.69, 13.77, 20.89]

y = [0.28773, 1.036889, 1.043178, 1.595322, 1.543763]

new_x = [0, 2, 4, 6, 8, 9, 10, 11, 12, 13, 14, 15, 16, 17, 18, 20]
matlabinterp1和scipy.interpolateinterp1d的结果是不一样的。
结果是这样的。
new_y_scipy=[0.401171, 0.625806, 0.850442, 1.062384, 1.186291, 1.248244, 1.310198, 1.372152, 1.434105, 1.496059, 1.545429, 1.55267, 1.559911, 1.567153, 1.574394, 1.588877,]

new_y_matlab=[0.401171, 0.625806, 0.850442, 1.064362, 1.201031, 1.269366, 1.3377, 1.406035, 1.47437, 1.542704, 1.593656, 1.586415, 1.579174, 1.571932, 1.564691, 1.550208]
显然 matlab 似乎比 scipy 得到更好的结果。根本区别是什么?
最佳答案
我认为您来自 scipy 的数据可能以某种方式被弄乱了,因为我无法重现您的问题。对我来说,scipy 的结果与您的 matlab 的结果完全匹配。请参见下面的演示:
import numpy as np
from scipy.interpolate import interp1d
import matplotlib.pyplot as plt
x = [-1.01, 5.66, 5.69, 13.77, 20.89]
y = [0.28773, 1.036889, 1.043178, 1.595322, 1.543763]
new_x = [0, 2, 4, 6, 8, 9, 10, 11, 12, 13, 14, 15, 16, 17, 18, 20]
new_y_scipy=[0.401171, 0.625806, 0.850442, 1.062384, 1.186291, 1.248244, 1.310198, 1.372152, 1.434105, 1.496059, 1.545429, 1.55267, 1.559911, 1.567153, 1.574394, 1.588877,]
new_y_matlab=[0.401171, 0.625806, 0.850442, 1.064362, 1.201031, 1.269366, 1.3377, 1.406035, 1.47437, 1.542704, 1.593656, 1.586415, 1.579174, 1.571932, 1.564691, 1.550208]
askewchan = interp1d(x,y)(new_x)
# 'linear' has no effect since it's the default, but I'll plot it too:
set_interp = interp1d(x, y, kind='linear')
new_y = set_interp(new_x)
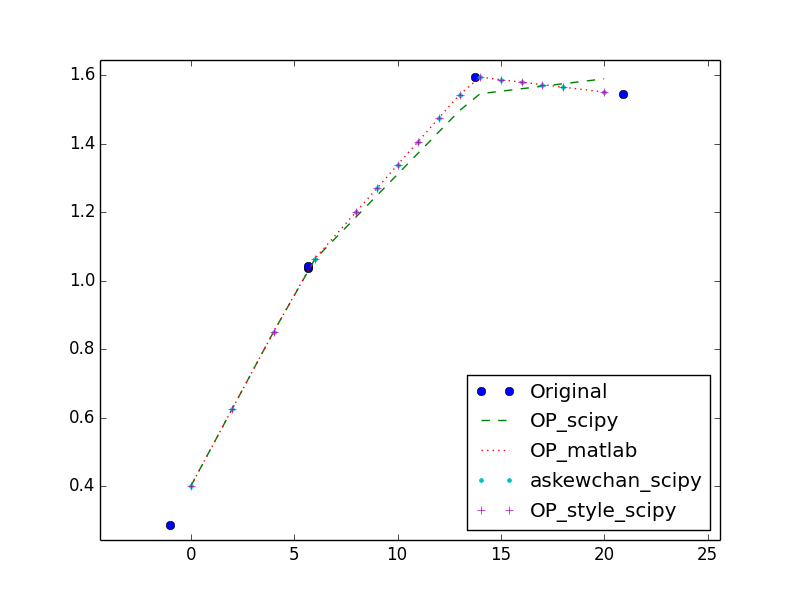
plt.plot(x, y, 'o', new_x, new_y_scipy, '--', new_x, new_y_matlab, ':', new_x, askewchan, '.', new_x, new_y, '+')
plt.legend(('Original','OP_scipy', 'OP_matlab', 'askewchan_scipy', 'OP style scipy'), loc='lower right')
np.allclose(new_y_matlab, interp1d(x,y)(new_x))
#True
关于matlab - Scipy interp1d 和 matlab interp1,我们在Stack Overflow上找到一个类似的问题: https://stackoverflow.com/questions/19956388/