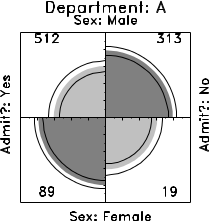
我正在尝试创建一个 fourfold display在 matplotlib 中:
但是获取不到极轴的逻辑。到目前为止,这是我尝试过的:
import numpy as np
import matplotlib.pyplot as plt

# radius of each bar
radii = [10,  15, 20, 25]

# Value - width
width = np.pi/ 2

# angle of each bar
theta = [0,90,180,270]

ax = plt.subplot(111, polar=True)
bars = ax.bar(theta, radii, width=width)
plt.show()
不确定我缺少什么,但我只想要四个相互接触的“相等”区域。我无法上类的是
如何“控制”角度?我的意思是让所有四张“幻灯片”都在
[0,90]、[90,180]、[180, 270]、[270, 360]中。我不明白“width”对应的是什么。
最佳答案
theta 应以弧度为单位,而不是度数。
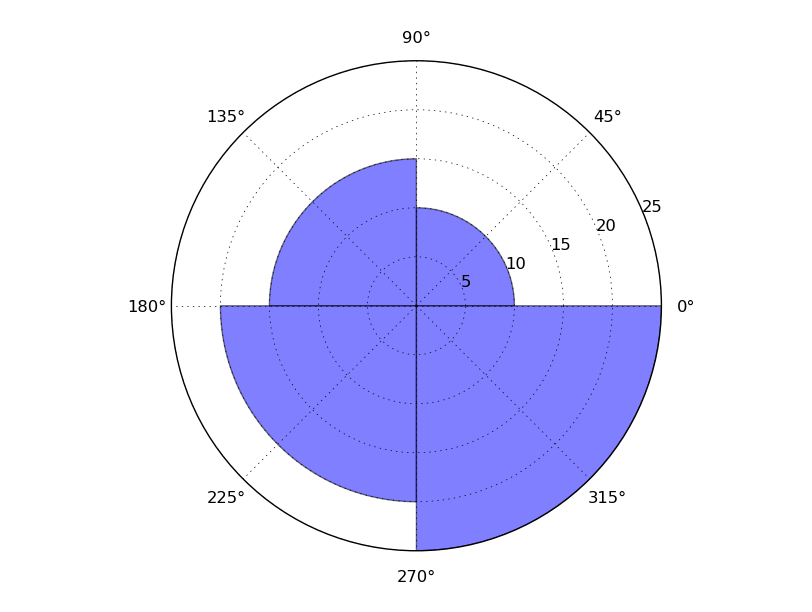
如果您只是稍微调整一下代码:
import numpy as np
import matplotlib.pyplot as plt

# radius of each bar
radii = [10,  15, 20, 25]

# Value - width
width = np.pi/ 2

# angle of each bar
theta = np.radians([0,90,180,270])

ax = plt.subplot(111, polar=True)
bars = ax.bar(theta, radii, width=width, alpha=0.5)
plt.show()
你会得到你所期望的:
旁注,对于您正在制作的确切图,在脊柱居中的矩形图上使用 4 个楔形可能更有意义。
关于python - 使用极轴在 matplotlib 中进行四重显示,我们在Stack Overflow上找到一个类似的问题: https://stackoverflow.com/questions/22306555/