我正在尝试绘制两个子图是第一个子图的放大图。 我想做的是像下图这样的事情:
特别是黑线。我现在的代码只是绘制子图
import matplotlib.pyplot as plt
import numpy as np

t=np.arange(1000)
x=np.sin(np.arange(1000)/10)

plt.figure()
ax1 = plt.subplot(2,1,1)
plt.plot(t,x)

ax2 = plt.subplot(2,2,3)
plt.plot(t[100:200],x[100:200])

ax3 = plt.subplot(2,2,4)
plt.plot(t[600:700],x[600:700])

plt.show()
但我不知道如何在图形顶部添加黑线(以制作缩放框效果)。我不知道如何开始。有人有想法吗?
最佳答案
事实上,我发现了另一个与我想要的非常相似的主题: Use subplots to zoom into timeseries or how I can draw lines outside of axis borders
这里是代码:
import matplotlib.pyplot as plt
import numpy as np
from matplotlib.patches import Rectangle
def zoomingBox(ax1, roi, ax2, color='red', linewidth=2):
ax1.add_patch(Rectangle([roi[0],roi[2]], roi[1]-roi[0], roi[3]-roi[2],**dict([('fill',False), ('linestyle','dashed'), ('color',color), ('linewidth',linewidth)]) ))
srcCorners = [[roi[0],roi[2]], [roi[0],roi[3]], [roi[1],roi[2]], [roi[1],roi[3]]]
dstCorners = ax2.get_position().corners()
srcBB = ax1.get_position()
dstBB = ax2.get_position()
if (dstBB.min[0]>srcBB.max[0] and dstBB.max[1]<srcBB.min[1]) or (dstBB.max[0]<srcBB.min[0] and dstBB.min[1]>srcBB.max[1]):
src = [0, 3]; dst = [0, 3]
elif (dstBB.max[0]<srcBB.min[0] and dstBB.max[1]<srcBB.min[1]) or (dstBB.min[0]>srcBB.max[0] and dstBB.min[1]>srcBB.max[1]):
src = [1, 2]; dst = [1, 2]
elif dstBB.max[1] < srcBB.min[1]:
src = [0, 2]; dst = [1, 3]
elif dstBB.min[1] > srcBB.max[1]:
src = [1, 3]; dst = [0, 2]
elif dstBB.max[0] < srcBB.min[0]:
src = [0, 1]; dst = [2, 3]
elif dstBB.min[0] > srcBB.max[0]:
src = [2, 3]; dst = [0, 1]
for k in range(2):
ax1.annotate('', xy=dstCorners[dst[k]], xytext=srcCorners[src[k]], xycoords='figure fraction', textcoords='data', arrowprops=dict([('arrowstyle','-'), ('color',color), ('linewidth',linewidth)]))
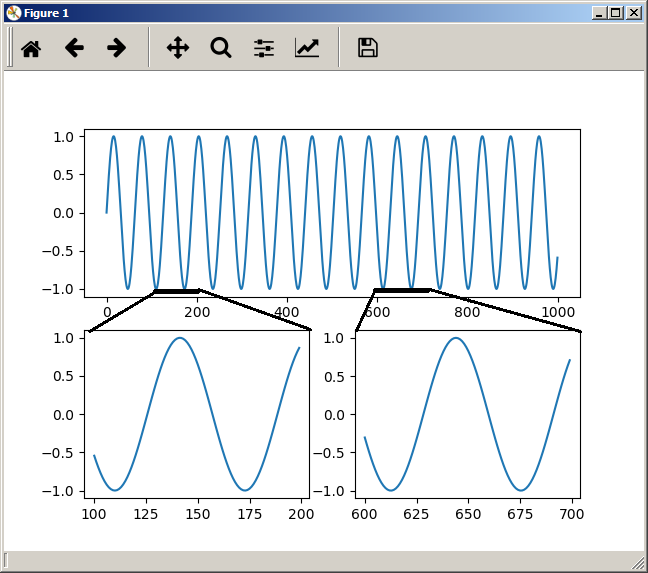
t=np.arange(1000)
x=np.sin(np.arange(1000)/10)
plt.figure()
ax1 = plt.subplot(2,1,1)
plt.plot(t,x)
ax2 = plt.subplot(2,2,3)
plt.plot(t[100:200],x[100:200])
ax3 = plt.subplot(2,2,4)
plt.plot(t[600:700],x[600:700])
zoomingBox(ax1, [100,200,-1.1,1.1], ax2)
zoomingBox(ax1, [600,700,-1.1,1.1], ax3)
plt.show()
这给了这个:

关于python - 在子图顶部画线以呈现缩放效果,我们在Stack Overflow上找到一个类似的问题: https://stackoverflow.com/questions/44670708/