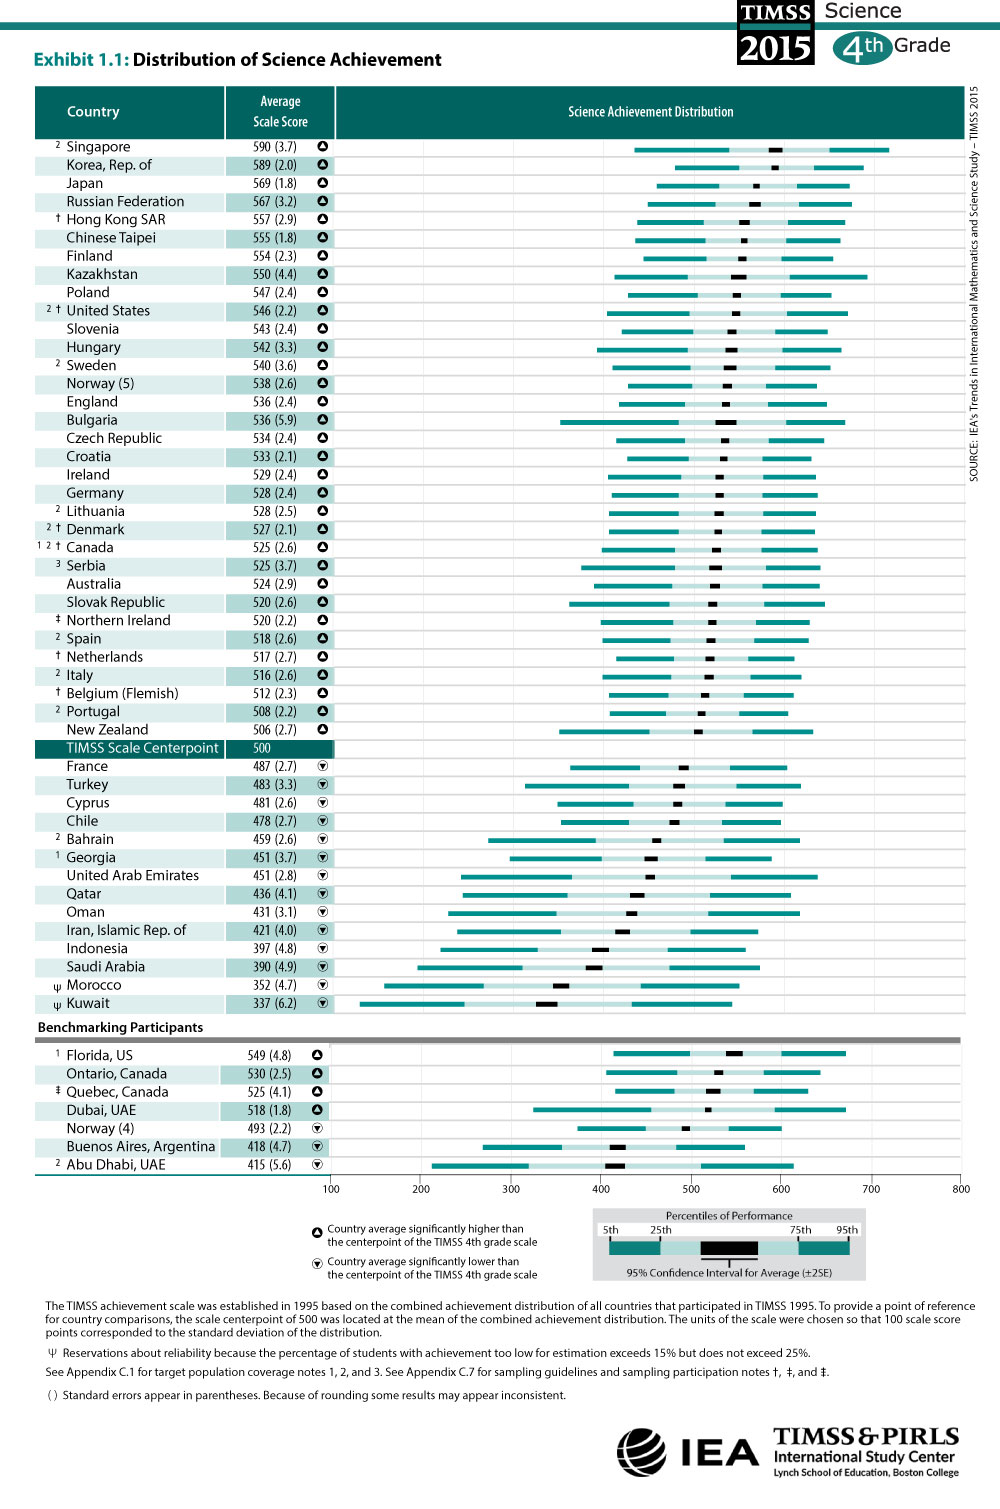
在最近的 TIMSS report我碰巧遇到的,有一个情节(如下所示)在我看来非常具有交际性。我读过这样的图被称为克利夫兰点图,尽管这个图也增加了置信区间。我想知道它是否可以在 ggplot2 或 matplotlib 中重现。欢迎所有提示。

(来源:timss2015.org)
最佳答案
使用 iris 数据集:
library(dplyr)
library(ggplot2)

plot_data <- iris %>%
  group_by(Species) %>%
  summarise_each(funs(mean, sd, n(), q95=quantile(., 0.95), q75=quantile(., 3/4), q25=quantile(., 1/4),  q5 = quantile(., 0.05)), Sepal.Length) %>%
  mutate(se = sd/sqrt(n),
         left95 = mean - 2*se,
         right95 = mean + 2*se)


ggplot(plot_data, aes(x = Species, y = mean)) +
  geom_crossbar(aes(ymin = q5, ymax = q95), fill = "aquamarine1",  color = "aquamarine1", width = 0.2) +
  geom_crossbar(aes(ymin = q25, ymax = q75), fill = "aquamarine4",  color = "aquamarine4", width = 0.2) +
  geom_crossbar(aes(ymin = left95, ymax = right95), fill = "black", color = "black", width = 0.2) +
  coord_flip() +
  theme_minimal()

这应该让您了解如何使用 ggplot2 来完成此任务。您提供的数据可以轻松使用,无需 dplyr 汇总。
关于python - ggplot2 中的克利夫兰点图,我们在Stack Overflow上找到一个类似的问题: https://stackoverflow.com/questions/40935105/