假设我有一个类似的函数
def coulomb(x,y):
    r = sqrt(x**2 + y**2)
    return 1/r if r > 1 else None
我怎样才能最好地在彩色图中绘制它,以便每个 None 值都简单地呈现为例如白色,只有分配给色标的实际数值?喜欢,
fig = plt.figure()
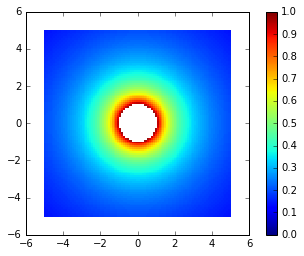
xs, ys = meshgrid(linspace(-5, 5, n), linspace(-5, 5, n))
vs = 1/sqrt(xs**2 + ys**2)
ax = fig.add_subplot(1, 1, 1, aspect='equal')
fig.colorbar(ax.pcolor(xs,ys,vs, vmin=0, vmax=1))

但中心区域为空白而不是深红色。
最佳答案
只需使用掩码数组:
from numpy import ma
vs_ma = ma.masked_where(vs > 1, vs)
plt.colorbar(plt.pcolor(xs, ys, vs_ma, vmin=0, vmax=1))

matplotlib 有一个更复杂的例子 image_masked.py您可以在其中选择屏蔽区域的颜色。要在普通数组和屏蔽数组之间进行转换,您可以使用 numpy.ma.masked_* 之一功能
关于python - 如何制作带有未定义区域的彩色图?,我们在Stack Overflow上找到一个类似的问题: https://stackoverflow.com/questions/39021353/