我是 python 的新手,我正在尝试使用 matplotlib 和子图的 PdfPages 将大量数据保存到带有数字的 pdf 中。问题是我发现了一个我不知道如何解决的问题,代码是这样的:
import matplotlib.pyplot as plt
from matplotlib.backends.backend_pdf import PdfPages

with PdfPages('myfigures.pdf') as pdf:
for i in range(1000):
    f,axarr = plt.subplots(2, 3)
    plt.subplots(2, 3)
    axarr[0, 0].plot(x1, y1)
    axarr[1, 0].plot(x2, y2)

    pdf.savefig(f)
    plt.close('all')
在每个循环中创建一个图形非常耗时,但如果我将其放在循环之外,它不会清除每个图。我尝试过的其他选项,如 clear() 或 clf() 也没有工作,或者最终创建了多个不同的图形,有人想知道如何以不同的方式放置它以使其运行得更快吗?
最佳答案
附加 matplotlib 的多页 PDF
创建 𝑚-rows × 𝑛-cols 每个 pdf page 子图 axes 数组的矩阵并保存 ( append) 当每个页面的子图矩阵完全填满时 → 然后创建新页面,重复,𝐞𝐭𝐜。
要在单个 pdf 中包含大量子图作为多页输出,请立即开始用您的图填充第一页,然后您需要在检测到迭代中添加的最新子图后创建一个新页面绘图生成的可用空间已达到当前页面的 𝑚 行 × 𝑛 列子图数组布局 [即 𝑚 × 𝑛 子图矩阵] 的可用空间(如适用)。
这是一种方法,可以轻松更改控制每页子图数量的维度 (𝑚 × 𝑛):
    import sys

    import matplotlib
    from matplotlib.backends.backend_pdf import PdfPages
    import matplotlib.pyplot as plt
    import numpy as np


    matplotlib.rcParams.update({"font.size": 6})

    # Dimensions for any m-rows × n-cols array of subplots / pg.
    m, n = 4, 5

    # Don't forget to indent after the with statement
    with PdfPages("auto_subplotting.pdf") as pdf:

        """Before beginning the iteration through all the data,
        initialize the layout for the plots and create a
        representation of the subplots that can be easily
        iterated over for knowing when to create the next page
        (and also for custom settings like partial axes labels)"""
        f, axarr = plt.subplots(m, n, sharex="col", sharey="row")
        arr_ij = [(x, y) for x, y in np.ndindex(axarr.shape)]
        subplots = [axarr[index] for index in arr_ij]

        # To conserve needed plotting real estate,
        # only label the bottom row and leftmost subplots
        # as determined automatically using m and n
        splot_index = 0
        for s, splot in enumerate(subplots):
            splot.set_ylim(0, 0.15)
            splot.set_xlim(0, 50)
            last_row = m * n - s < n + 1
            first_in_row = s % n == 0
            if last_row:
                splot.set_xlabel("X-axis label")
            if first_in_row:
                splot.set_ylabel("Y-axis label")

        # Iterate through each sample in the data
        for sample in range(33):

            # As a stand-in for real data, let's just make numpy take 100 random draws
            # from a poisson distribution centered around say ~25 and then display
            # the outcome as a histogram
            scaled_y = np.random.randint(20, 30)
            random_data = np.random.poisson(scaled_y, 100)
            subplots[splot_index].hist(
                random_data,
                bins=12,
                normed=True,
                fc=(0, 0, 0, 0),
                lw=0.75,
                ec="b",
            )

            # Keep collecting subplots (into the mpl-created array;
            # see: [1]) through the samples in the data and increment
            # a counter each time. The page will be full once the count is equal
            # to the product of the user-set dimensions (i.e. m * n)
            splot_index += 1

            """Once an mxn number of subplots have been collected
            you now have a full page's worth, and it's time to
            close and save to pdf that page and re-initialize for a
            new page possibly. We can basically repeat the same
            exact code block used for the first layout
            initialization, but with the addition of 3 new lines:
             +2 for creating & saving the just-finished pdf page,
             +1 more to reset the subplot index (back to zero)"""
            if splot_index == m * n:
                pdf.savefig()
                plt.close(f)
                f, axarr = plt.subplots(m, n, sharex="col", sharey="row")
                arr_ij = [(x, y) for x, y in np.ndindex(axarr.shape)]
                subplots = [axarr[index] for index in arr_ij]
                splot_index = 0
                for s, splot in enumerate(subplots):
                    splot.set_ylim(0, 0.15)
                    splot.set_xlim(0, 50)
                    last_row = (m * n) - s < n + 1
                    first_in_row = s % n == 0
                    if last_row:
                        splot.set_xlabel("X-axis label")
                    if first_in_row:
                        splot.set_ylabel("Y-axis label")

        # Done!
        # But don't forget to save to pdf after the last page
        pdf.savefig()
        plt.close(f)
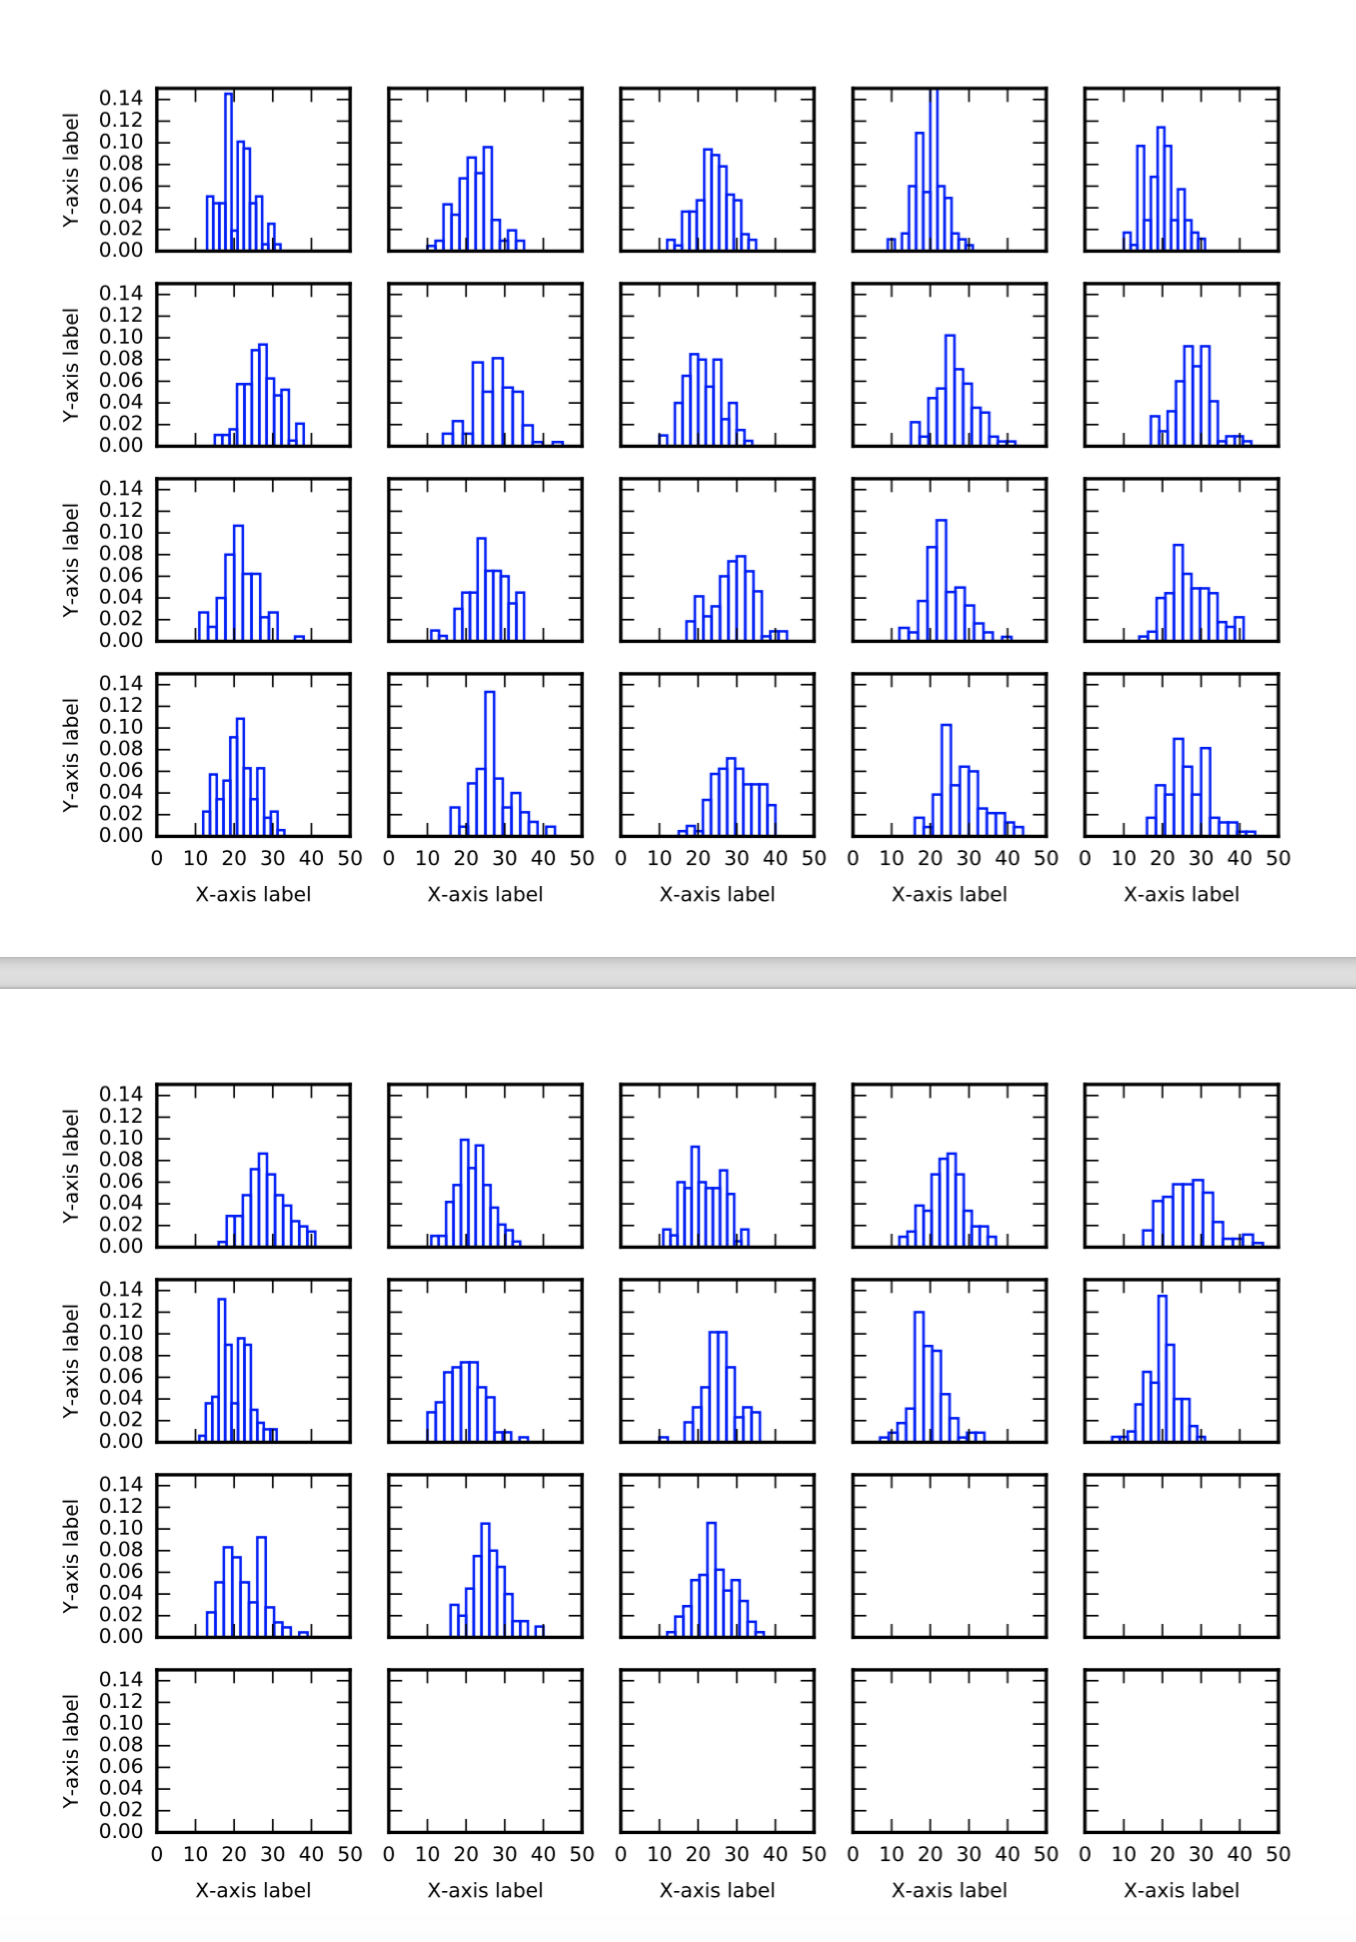
对于任何m×n 布局,只需分别更改m 和n 值的声明。从上面的代码(其中“m, n = 4, 5”),一个 4x5 的子图矩阵和总共 33 个样本被生成为一个两页的 pdf 输出文件:
引用资料
Note: There will be, on the final page of the multipage PDF, a number of blank subplots equal to the remainder from the the product of your chosen subplots 𝑚 × 𝑛 layout dimension numbers and your total number of samples/data to plot. E.g., say m=3, and n=4, thus you get 3 rows of 4 subplots each equals 12 per page, and if you had say 20 samples, then there would be a two-page pdf auto-created with a total of 24 subplots with the last 4 (so full bottom-most row in this hypothetical example) of subplots on the second page empty.
使用seaborn
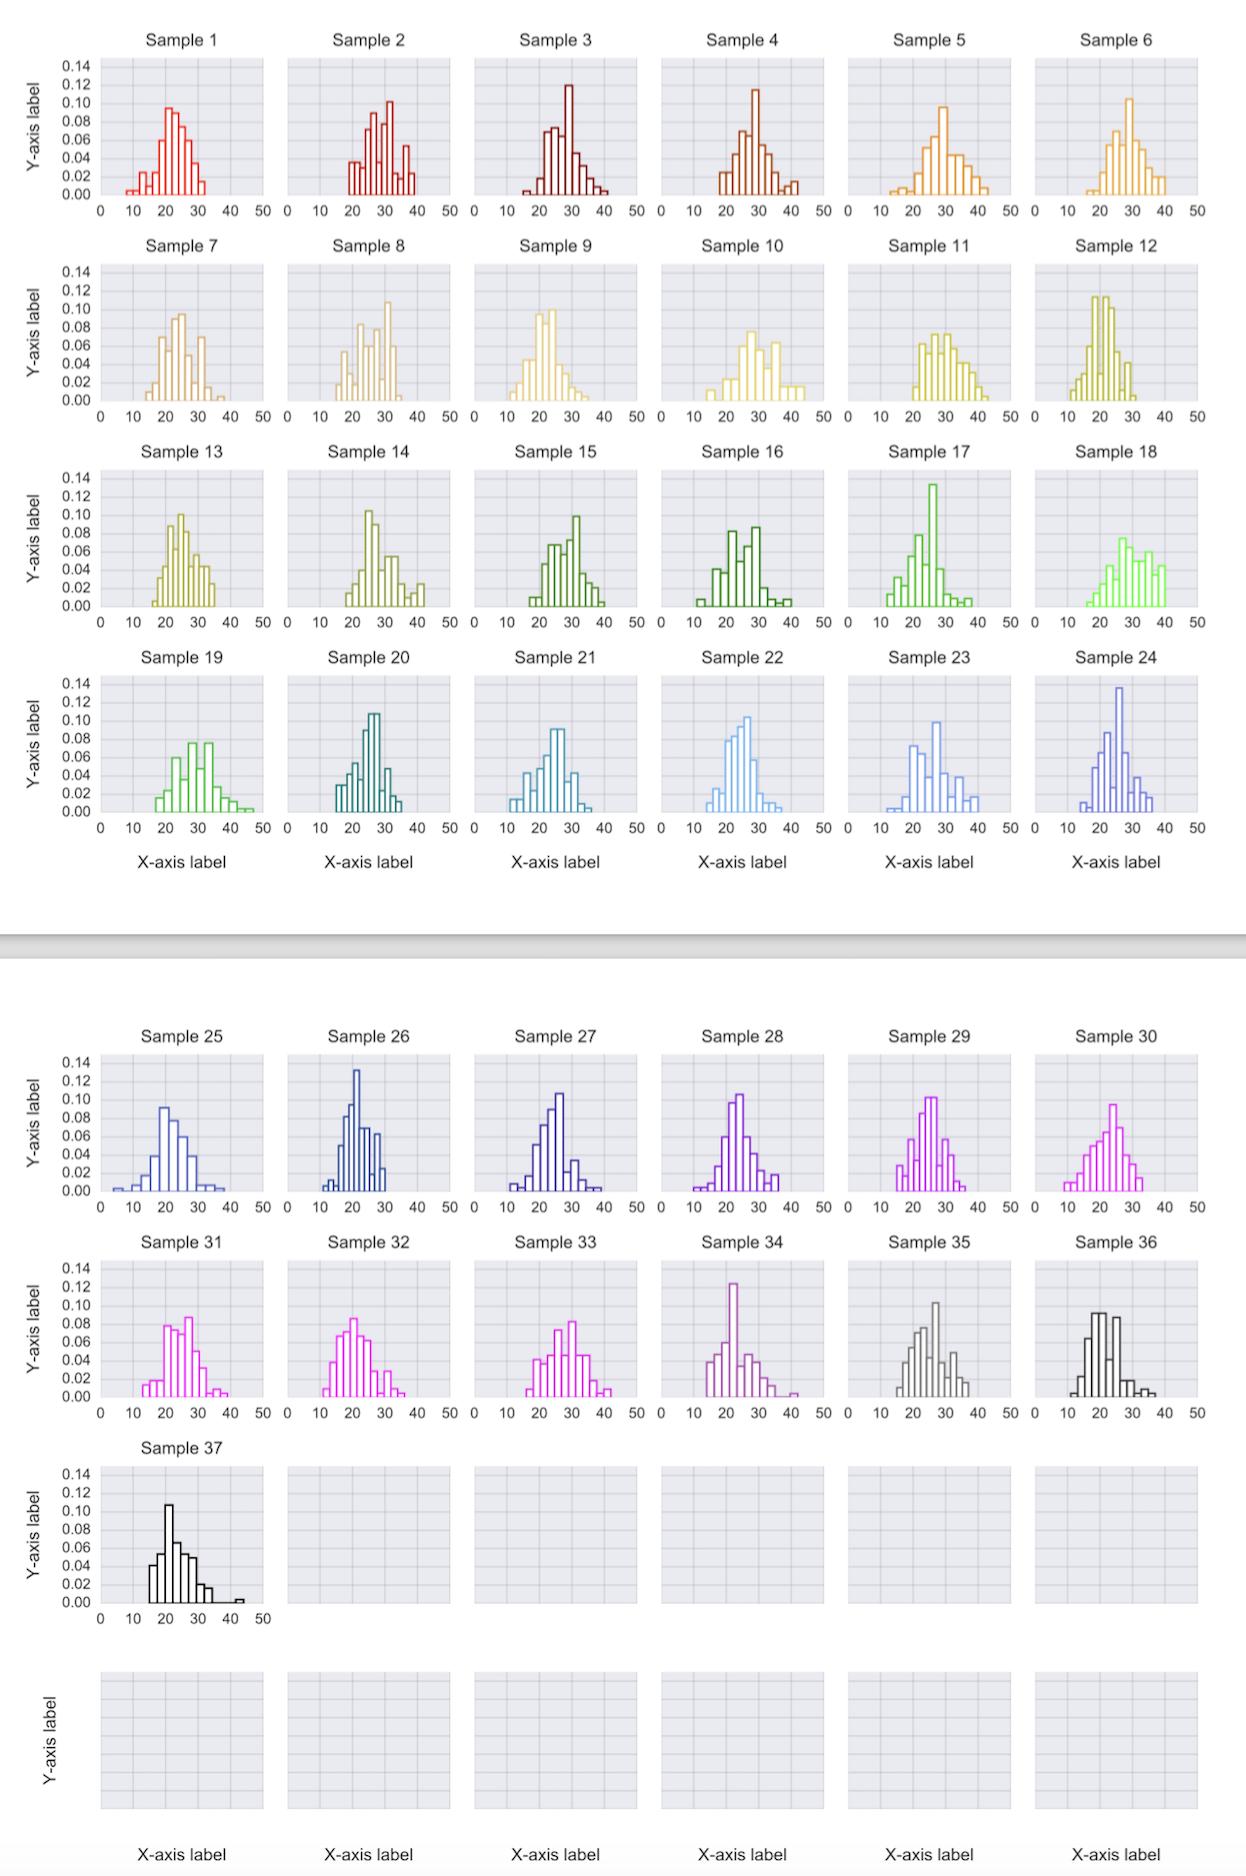
对于上述实现的更高级(和更多“pythonic”*)扩展,请参见下文:
多页处理可能应该通过创建一个 new_page 函数来简化;最好不要逐字重复代码*,尤其是当您开始自定义绘图时,在这种情况下,您不想复制每一个更改并输入相同的内容两次。基于 seaborn 并利用可用的 matplotlib 参数(如下所示)的更加自定义的美学也可能更可取。
添加一个 new_page 函数和一些子图样式的自定义:
    import matplotlib.pyplot as plt
    import numpy as np
    import random
    import seaborn as sns

    from matplotlib.backends.backend_pdf import PdfPages

    # this erases labels for any blank plots on the last page
    sns.set(font_scale=0.0)
    m, n = 4, 6
    datasize = 37
    # 37 % (m*n) = 13, (m*n) - 13 = 24 - 13 = 11. Thus 11 blank subplots on final page

    # custom colors scheme / palette
    ctheme = [
        "k", "gray", "magenta", "fuchsia", "#be03fd", "#1e488f",
        (0.44313725490196076, 0.44313725490196076, 0.88627450980392153), "#75bbfd",
        "teal", "lime", "g", (0.6666674, 0.6666663, 0.29078014184397138), "y",
        "#f1da7a", "tan", "orange", "maroon", "r", ] # pick whatever colors you wish
    colors = sns.blend_palette(ctheme, datasize)
    fz = 7  # labels fontsize


    def new_page(m, n):
        global splot_index
        splot_index = 0
        fig, axarr = plt.subplots(m, n, sharey="row")
        plt.subplots_adjust(hspace=0.5, wspace=0.15)
        arr_ij = [(x, y) for x, y in np.ndindex(axarr.shape)]
        subplots = [axarr[index] for index in arr_ij]
        for s, splot in enumerate(subplots):
            splot.grid(
                b=True,
                which="major",
                color="gray",
                linestyle="-",
                alpha=0.25,
                zorder=1,
                lw=0.5,
            )
            splot.set_ylim(0, 0.15)
            splot.set_xlim(0, 50)
            last_row = m * n - s < n + 1
            first_in_row = s % n == 0
            if last_row:
                splot.set_xlabel("X-axis label", labelpad=8, fontsize=fz)
            if first_in_row:
                splot.set_ylabel("Y-axis label", labelpad=8, fontsize=fz)
        return (fig, subplots)


    with PdfPages("auto_subplotting_colors.pdf") as pdf:

        fig, subplots = new_page(m, n)

        for sample in xrange(datasize):
            splot = subplots[splot_index]
            splot_index += 1
            scaled_y = np.random.randint(20, 30)
            random_data = np.random.poisson(scaled_y, 100)
            splot.hist(
                random_data,
                bins=12,
                normed=True,
                zorder=2,
                alpha=0.99,
                fc="white",
                lw=0.75,
                ec=colors.pop(),
            )
            splot.set_title("Sample {}".format(sample + 1), fontsize=fz)
            # tick fontsize & spacing
            splot.xaxis.set_tick_params(pad=4, labelsize=6)
            splot.yaxis.set_tick_params(pad=4, labelsize=6)

            # make new page:
            if splot_index == m * n:
                pdf.savefig()
                plt.close(fig)
                fig, subplots = new_page(m, n)

        if splot_index > 0:
            pdf.savefig()
            plt.close(f)
关于python将多个子图图形保存为pdf,我们在Stack Overflow上找到一个类似的问题: https://stackoverflow.com/questions/38938454/