我正在尝试使用 kcachegrind 生成调用图,最好清楚地指示调用图中的哪些 block 对应于我的函数。我关注了this answer作为测试运行,并得到不同的输出。我不明白我需要做什么来重复这个例子的结果。 如何让 kcachegrind 在调用图中显示我的函数名称?
为方便起见,这里是我使用的确切代码:
int f2(int i) { return i + 2; }
int f1(int i) { return f2(2) + i + 1; }
int f0(int i) { return f1(1) + f2(2); }
int pointed(int i) { return i; }
int not_called(int i) { return 0; }

int main(int argc, char **argv) {
    int (*f)(int);
    f0(1);
    f1(1);
    f = pointed;
    if (argc == 1)
        f(1);
    if (argc == 2)
        not_called(1);
    return 0;
}
这个文件 (main.c) 是这样编译的:
gcc -ggdb3 -O0 -std=c99 main.c -o main
然后我调用了 valgrind:
valgrind --tool=callgrind ./main
输出如下:
==4770== Callgrind, a call-graph generating cache profiler
==4770== Copyright (C) 2002-2017, and GNU GPL'd, by Josef Weidendorfer et al.
==4770== Using Valgrind-3.13.0 and LibVEX; rerun with -h for copyright info
==4770== Command: ./main
==4770==
==4770== For interactive control, run 'callgrind_control -h'.
==4770==
==4770== Events    : Ir
==4770== Collected : 121502
==4770==
==4770== I   refs:      121,502
最后,我使用输出文件 (callgrind.out.4789) 启动了 kcachegrind:
kcachegrind callgrind.out.4789
根据我使用的示例,我希望调用图看起来像这样:

相反,我得到了如下所示的内容:

我该怎么做才能在调用图中显示我的函数名称?
最佳答案
根据@user6556709 的评论,加载程序和动态链接显示在我上面的图形输出中。引用的示例并未说明如何找到您的主要内容,但可以在 GUI 的“平面配置文件”部分中找到:
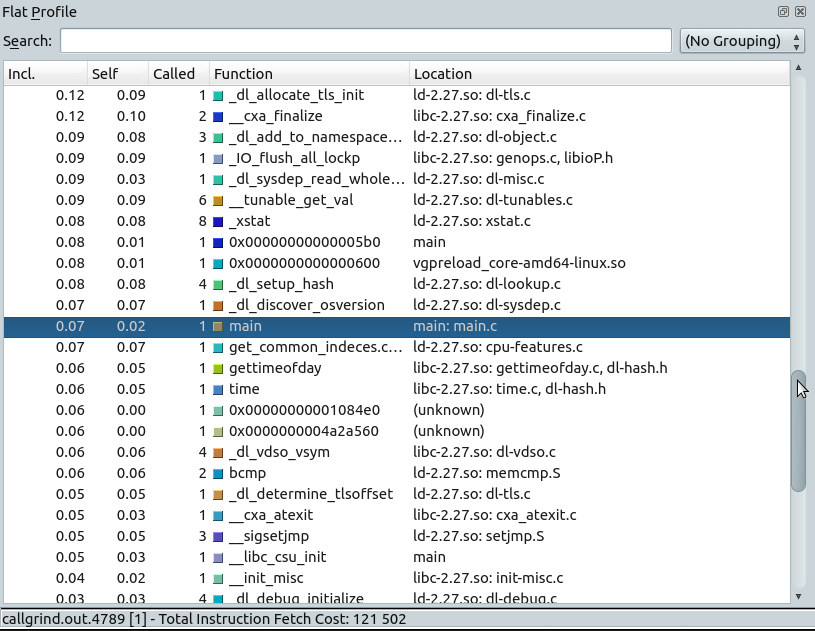
它需要一些挖掘才能找到——它可以按源分组以仅显示 .c/.h 文件,或者使用位置标题按位置名称排序并搜索 main。
关于c++ - 为什么 KCacheGrind 不显示我的函数名称?,我们在Stack Overflow上找到一个类似的问题: https://stackoverflow.com/questions/55984193/