我正在使用 Google Maps API V3 基于路径绘制多边形,该路径是随机未排序坐标点 (LatLng) 的数组。这会产生以下形状:
折线相交!!
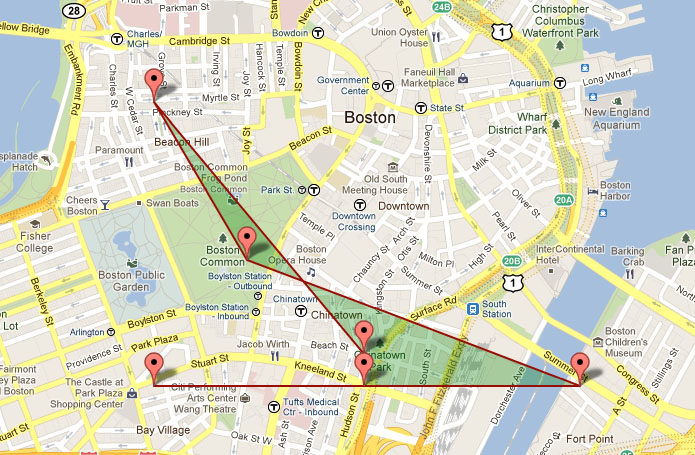
问题:由于多边形的形状取决于路径中点的顺序,我如何对路径进行排序以创建一个没有线相交且没有形成孔洞的多边形?还有一个多边形必须包围的引用点(图中未显示)。我相信这需要一个我找不到的排序算法!
没有交集:)

虽然这个多边形是用Javascript生成的,但是请随意使用任何语言来解决这个问题
编辑:多边形必须包含一个引用点,但该点不会是多边形的任何顶点
最佳答案
有趣的问题。我相信这有效,但请测试一下。好久没触发了。
评论基本解释清楚了。我找到一个“中心”点(不确定这是否防弹,可能有更好的计算方法或者它可能无关紧要),计算出每个点围绕该点的度数,然后按该点排序.用不同的点测试它,它似乎工作。
var points = [
                {x: 40, y: 40},
                {x: 60, y: 40},
                {x: 60, y: 60},
                {x: 40, y: 60},
                {x: 0, y: 50},
                {x: 50, y: 0},
                {x: 50, y: 100},
                {x: 100, y: 50}
            ];


// get the canvas element using the DOM
var canvas = document.getElementById('canvas');

// Make sure we don't execute when canvas isn't supported
if (canvas.getContext) {

    // use getContext to use the canvas for drawing
    var ctx = canvas.getContext('2d');

    ctx.fillStyle = "red";


    // calculate max and min x and y
    var minX = points[0].x;
    var maxX = points[0].x;
    var minY = points[0].y;
    var maxY = points[0].y;

    for (var i = 1; i < points.length; i++) {
        if (points[i].x < minX) minX = points[i].x;
        if (points[i].x > maxX) maxX = points[i].x;
        if (points[i].y < minY) minY = points[i].y;
        if (points[i].y > maxY) maxY = points[i].y;
    }


    // choose a "central" point
    var center = {
        x: minX + (maxX - minX) / 2,
        y: minY + (maxY - minY) / 2
    };

    // precalculate the angles of each point to avoid multiple calculations on sort
    for (var i = 0; i < points.length; i++) {
        points[i].angle = Math.acos((points[i].x - center.x) / lineDistance(center, points[i]));

        if (points[i].y > center.y) {
            points[i].angle = Math.PI + Math.PI - points[i].angle;
        }
    }

    // sort by angle
    points = points.sort(function(a, b) {
        return a.angle - b.angle;
    });

    // Draw shape
    ctx.beginPath();
    ctx.moveTo(points[0].x, points[0].y);

    for (var i = 1; i < points.length; i++) {
        ctx.lineTo(points[i].x, points[i].y);
    }

    ctx.lineTo(points[0].x, points[0].y);

    ctx.stroke();
    ctx.fill();
}


function lineDistance(point1, point2) {
    var xs = 0;
    var ys = 0;

    xs = point2.x - point1.x;
    xs = xs * xs;

    ys = point2.y - point1.y;
    ys = ys * ys;

    return Math.sqrt(xs + ys);
}
编辑:阅读您的编辑后,如果此“引用点”已知且位于多边形内,则应将“中心”替换为该点。
关于javascript - 绘制多边形,我们在Stack Overflow上找到一个类似的问题: https://stackoverflow.com/questions/8154899/