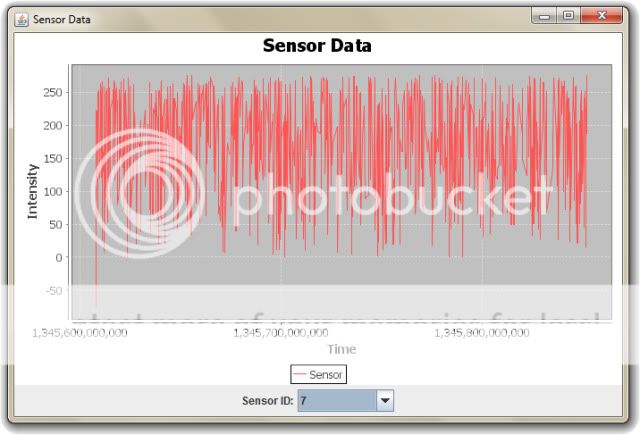
我目前有一种方法可以查询数据库中的值,并将它们绘制成图表。唯一的问题是,time 变量很长,导致我的图表如下所示:
我想将其转换为日期格式,然后将其添加到图表中。
我该怎么做?
这是我的图表代码:
private Long time;
private Long intensity;
public XYSeries series = new XYSeries("Sensor");
private XYDataset xyDataset;
public JFreeChart chart;

xyDataset = new XYSeriesCollection(series);
chart = ChartFactory.createXYLineChart("Sensor Data", "Time", "Intensity", xyDataset, PlotOrientation.VERTICAL, true, true, false);
这是我添加到图表的方法:
public void GetDustLevels() {
    series.clear();
    try {
        currentSensor = Application.getInstance().getMinesite().getSensors().get(sensorID);
    } catch (Exception e1) {
        e1.printStackTrace();
    }

    if (currentSensor != null) {
        sensorKDTree = currentSensor.getSensorData();
        Iterator<Map.Entry<GenericPoint<Long>, String>> allPoints = sensorKDTree.iterator(sensorKDTree.getMin(null), sensorKDTree.getMax(null));

        while (allPoints.hasNext()) {
            GenericPoint<Long> timeIntensityPair = allPoints.next().getKey();
            time = timeIntensityPair.getCoord(0);
            intensity = timeIntensityPair.getCoord(1);
            System.out.println("CURRENT SENSOR" + currentSensor);
            System.out.println("TIME: " + time + " " + "INTENSITY: " + intensity);
            series.add(time, intensity);
        }

    }


}
任何帮助将不胜感激!谢谢!
编辑:我已将我的代码更改为:
public TimeSeries series = new TimeSeries("Sensor", Date.class);
public JFreeChart chart;
private Long time;
private Long intensity;

TimeSeriesCollection xyDataset = new TimeSeriesCollection(series);
chart = ChartFactory.createTimeSeriesChart("Sensor Data", "Time", "Intensity", xyDataset, true, true, false);
还有我的新 GetDustLevels() 方法:
 public void GetDustLevels() {
    series.clear();
    try {
        currentSensor = Application.getInstance().getMinesite().getSensors().get(sensorID);
    } catch (Exception e1) {
        e1.printStackTrace();
    }

    if (currentSensor != null) {
        sensorKDTree = currentSensor.getSensorData();
        Iterator<Map.Entry<GenericPoint<Long>, String>> allPoints = sensorKDTree.iterator(sensorKDTree.getMin(null), sensorKDTree.getMax(null));

        while (allPoints.hasNext()) {
            GenericPoint<Long> timeIntensityPair = allPoints.next().getKey();
            time = timeIntensityPair.getCoord(0);
            intensity = timeIntensityPair.getCoord(1);
            System.out.println("CURRENT SENSOR" + currentSensor);
            System.out.println("TIME: " + time + " " + "INTENSITY: " + intensity);
            XYPlot plot = (XYPlot) chart.getPlot();
            DateAxis axis = (DateAxis) plot.getDomainAxis();
            axis.setDateFormatOverride(new SimpleDateFormat("dd-MMM-yyyy"));
            series.add(new Date(time.longValue()), intensity);
        }

    }


}
最佳答案
没有 sscce或所需的格式,我只是在猜测合适的 DateFormat .
XYPlot plot = (XYPlot) chart.getPlot();
DateAxis axis = (DateAxis) plot.getDomainAxis();
axis.setDateFormatOverride(DateFormat.getDateInstance());
附录:仔细观察您的更新,您正在使用 ChartFactory.createXYLineChart(),它为域创建一个 NumberAxis。相反,使用 ChartFactory.createTimeSeriesChart(),它会为域创建一个 DateAxis。
附录:如果 time 表示与 Java Date 相同纪元的毫秒数,您可以使用 new Date(time.longValue()) 构建数据集的 RegularTimePeriod。有一个相关的例子 here .
关于java - 将日期/时间添加到 JFreeChart 图形,我们在Stack Overflow上找到一个类似的问题: https://stackoverflow.com/questions/12272679/