我有 79 个纬度和经度,我有数据可以用 Python 在 basemap 上绘制。我有一个包含 79 个数字的数组,我想绘制这些数字而不是普通点(即我希望显示“1”或“2”而不是普通点)。我尝试了 plt.annotate 函数,但没有用。
import numpy as np
import matplotlib.pyplot as plt
from mpl_toolkits.basemap import Basemap

locs = np.genfromtxt('/Volumes/NO_NAME/Classwork/OK_vic_grid.txt')
lat = locs[:,1] # 79 values
lon = locs[:,2] # 79 values

m = Basemap(projection='stere',lon_0=-95,lat_0=35.,lat_ts=40,\
        llcrnrlat=33,urcrnrlat=38,\
        llcrnrlon=-103.8,urcrnrlon=-94)

X,Y = m(lon,lat)
m.drawcoastlines()
m.drawstates()
m.drawcountries()
m.drawmapboundary(fill_color='lightblue')
m.drawparallels(np.arange(0.,40.,2.),color='gray',dashes=[1,3],labels=[1,0,0,0])
m.drawmeridians(np.arange(0.,360.,2.),color='gray',dashes=[1,3],labels=[0,0,0,1])

m.scatter(X,Y)
????? (Want to plot an array "maxpc" which has 79 numbers that I want to plot the string of)
OK_vic_grid.txt:
1   33.75   -97.75
2   33.75   -97.25
3   33.75   -96.75
4   33.75   -96.25
5   33.75   -95.75
6   33.75   -95.25
7   33.75   -94.75
8   34.25   -99.75
9   34.25   -99.25
10  34.25   -98.75
11  34.25   -98.25
12  34.25   -97.75
13  34.25   -97.25
14  34.25   -96.75
15  34.25   -96.25
16  34.25   -95.75
17  34.25   -95.25
18  34.25   -94.75
19  34.75   -99.75
20  34.75   -99.25
21  34.75   -98.75
22  34.75   -98.25
23  34.75   -97.75
24  34.75   -97.25
25  34.75   -96.75
26  34.75   -96.25
27  34.75   -95.75
28  34.75   -95.25
29  34.75   -94.75
30  35.25   -99.75
31  35.25   -99.25
32  35.25   -98.75
33  35.25   -98.25
34  35.25   -97.75
35  35.25   -97.25
36  35.25   -96.75
37  35.25   -96.25
38  35.25   -95.75
39  35.25   -95.25
40  35.25   -94.75
41  35.75   -99.75
42  35.75   -99.25
43  35.75   -98.75
44  35.75   -98.25
45  35.75   -97.75
46  35.75   -97.25
47  35.75   -96.75
48  35.75   -96.25
49  35.75   -95.75
50  35.75   -95.25
51  35.75   -94.75
52  36.25   -99.75
53  36.25   -99.25
54  36.25   -98.75
55  36.25   -98.25
56  36.25   -97.75
57  36.25   -97.25
58  36.25   -96.75
59  36.25   -96.25
60  36.25   -95.75
61  36.25   -95.25
62  36.25   -94.75
63  36.75   -102.75
64  36.75   -102.25
65  36.75   -101.75
66  36.75   -101.25
67  36.75   -100.75
68  36.75   -100.25
69  36.75   -99.75
70  36.75   -99.25
71  36.75   -98.75
72  36.75   -98.25
73  36.75   -97.75
74  36.75   -97.25
75  36.75   -96.75
76  36.75   -96.25
77  36.75   -95.75
78  36.75   -95.25
79  36.75   -94.75
最佳答案
ax.scatter 和 ax.text 都需要一个 x, y 点,而不是一个位置数组。
两者都可以很好地工作,但您需要使用循环。
例如:
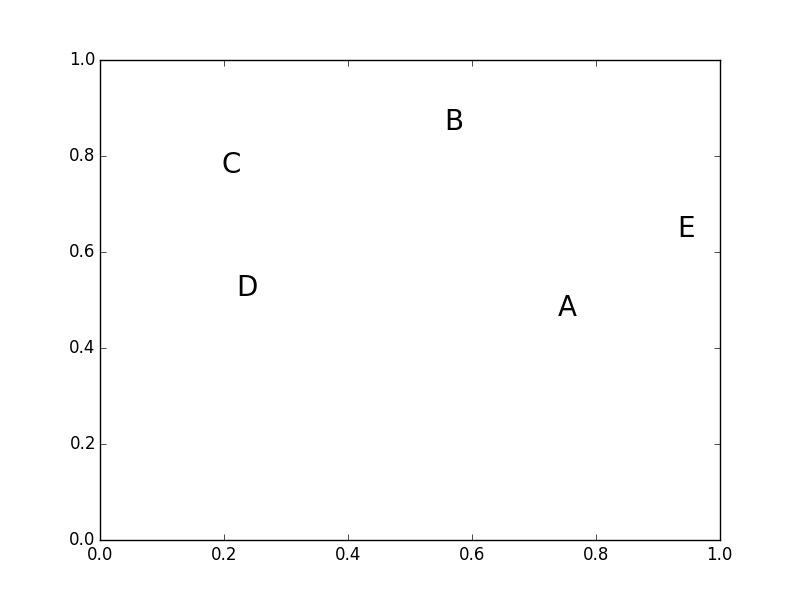
import numpy as np
import matplotlib.pyplot as plt

xy = np.random.random((5, 2))
text = ['A', 'B', 'C', 'D', 'E']

fig, ax = plt.subplots()
for (x,y), label in zip(xy, text):
    ax.text(x, y, label, ha='center', size=20)
plt.show()
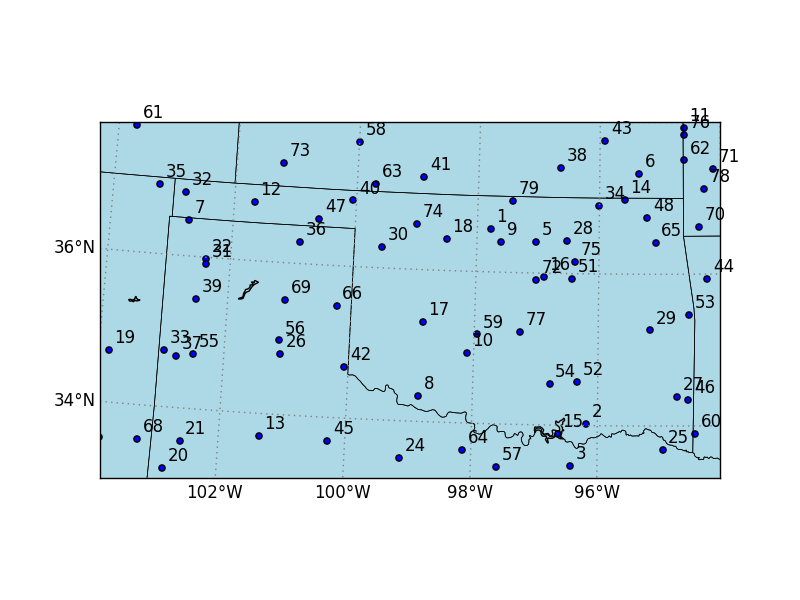
使用 basemap,您需要将经度和纬度投影到投影 map 坐标(即您的 X 和 Y 数组)。例如(我也会在这里使用 annotate 将标签偏移几个点):
import numpy as np
import matplotlib.pyplot as plt
from mpl_toolkits.basemap import Basemap

num = 79
lat = 5 * np.random.random(num) + 33
lon = 10 * np.random.random(num) - 104

fig, ax = plt.subplots()
m = Basemap(projection='stere',lon_0=-95,lat_0=35.,lat_ts=40,
            llcrnrlat=33,urcrnrlat=38,
            llcrnrlon=-103.8,urcrnrlon=-94,
            resolution='h', ax=ax)

X,Y = m(lon,lat)
m.drawcoastlines()
m.drawstates()
m.drawcountries()
m.drawmapboundary(fill_color='lightblue')
m.drawparallels(np.arange(0.,40.,2.),color='gray',dashes=[1,3],labels=[1,0,0,0])
m.drawmeridians(np.arange(0.,360.,2.),color='gray',dashes=[1,3],labels=[0,0,0,1])

ax.scatter(X,Y)

for i, (x, y) in enumerate(zip(X, Y), start=1):
    ax.annotate(str(i), (x,y), xytext=(5, 5), textcoords='offset points')

plt.show()
附带说明一下,您也可以考虑使用 cartopy而不是 basemap 。 basemap 或多或少已被 cartopy 完全取代。两者都是基于 matplotlib 的绘图工具包,cartopy 更好,i.m.o.。 map 轴是 Axes 的真正子类,因此没有单独的 Basemap 对象,它是一个真正的轴。此外,根据我的经验,Cartopy 的功能比 basemap 多一些,而且速度通常更快。
关于python - 在 Basemap 上绘制文本字符串代替 Python 中的点,我们在Stack Overflow上找到一个类似的问题: https://stackoverflow.com/questions/32707232/