我花了几个小时寻找答案,但我似乎找不到答案。
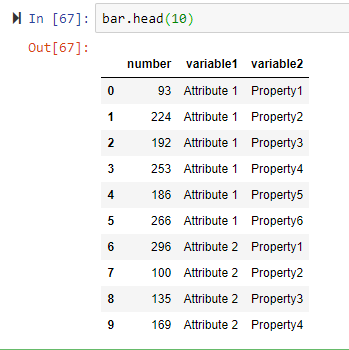
长话短说,我有一个数据框。以下代码将生成有问题的数据框(尽管使用随机数匿名):
variable1 = ["Attribute 1","Attribute 1","Attribute 1","Attribute 1","Attribute 1","Attribute 1","Attribute 2","Attribute 2",
         "Attribute 2","Attribute 2","Attribute 2","Attribute 2","Attribute 3","Attribute 3","Attribute 3","Attribute 3",
         "Attribute 3","Attribute 3","Attribute 4","Attribute 4","Attribute 4","Attribute 4","Attribute 4","Attribute 4",
         "Attribute 5","Attribute 5","Attribute 5","Attribute 5","Attribute 5","Attribute 5"]


variable2 = ["Property1","Property2","Property3","Property4","Property5","Property6","Property1","Property2","Property3",
         "Property4","Property5","Property6","Property1","Property2","Property3",
         "Property4","Property5","Property6","Property1","Property2","Property3","Property4",
         "Property5","Property6","Property1","Property2","Property3","Property4","Property5","Property6"]

number = [93,224,192,253,186,266,296,100,135,169,373,108,211,194,164,375,211,71,120,334,59,164,348,50,249,18,251,343,172,41]

bar = pd.DataFrame({"variable1":variable1, "variable2":variable2, "number":number})

bar_grouped = bar.groupby(["variable1","variable2"]).sum()
结果应该是这样的:
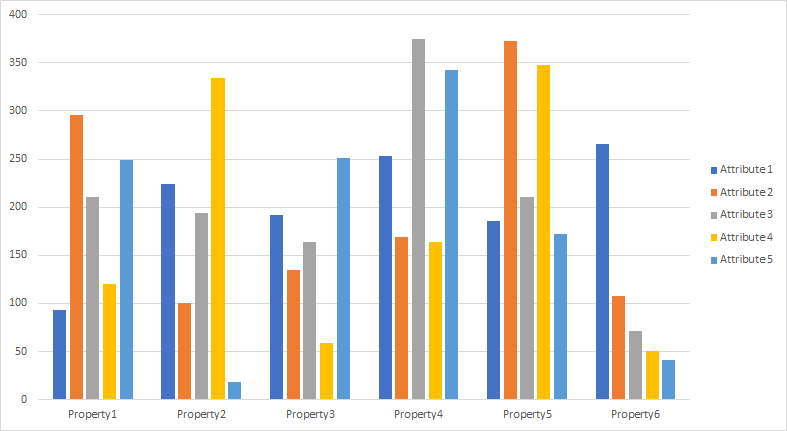
第二个:

我一直在尝试用条形图绘制它们,并将属性作为组,将不同的属性作为条形图。与此类似(虽然手动绘制在 Excel 中)。我更愿意在分组的 datafarme 中执行此操作,以便能够使用不同的分组进行绘图,而无需每次都重置索引。
我希望这是清楚的。
非常感谢对此的任何帮助。
谢谢! :)
最佳答案
我不会费心创建您的 groupby 结果(因为您没有聚合任何东西)。这是一个枢轴
bar.pivot('variable2', 'variable1', 'number').plot(kind='bar')

plt.tight_layout()
plt.show()

如果需要聚合,您仍然可以从bar开始并使用pivot_table
bar.pivot_table(index='variable2', columns='variable1', values='number', aggfunc='sum')
关于python - 绘制分组的 Pandas 数据框,我们在Stack Overflow上找到一个类似的问题: https://stackoverflow.com/questions/57376362/