我正在尝试创建一个 meshgrid,其中一些点没有落在具有指定坐标和半径的圆内。我无法减去落在圆圈内的网格点。 这是我的代码
import math
import numpy
import matplotlib.pyplot as plt


N = 50
x_start, x_end = -2.0, 2.0
y_start, y_end = -1.0, 1.0


x = numpy.linspace(x_start, x_end, N)
y = numpy.linspace(y_start, y_end, N)

circle_x, circle_y, r= 0.0, 0.0, 0.4

#x.remove((r-circle_x)**2)   #need some help with these two lines
#y.remove((r-circle_y)**2)


X, Y = numpy.meshgrid(x, y)


size = 10
fig = plt.figure()
plt.xlabel('x', fontsize = 16)
plt.ylabel('y', fontsize = 16)
plt.scatter(X, Y)
plt.show()
显示网格点的 meshgrid## 标题
最佳答案
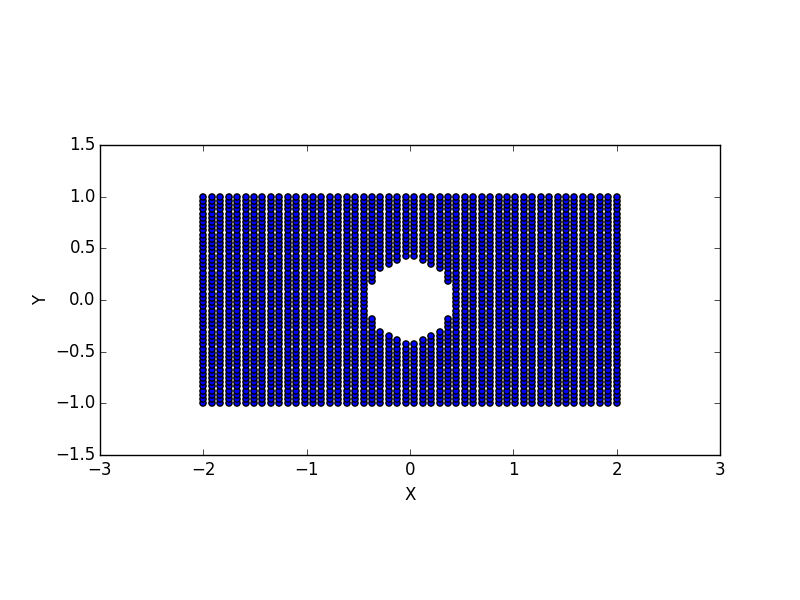
如果你想要一个只有圆外点的散点图,使用 bool 索引从你的二维“meshgridded”数组中选择那些点:
import numpy as np
import matplotlib.pyplot as plt

N = 50
x_start, x_end = -2.0, 2.0
y_start, y_end = -1.0, 1.0

x = np.linspace(x_start, x_end, N)
y = np.linspace(y_start, y_end, N)

x0, y0, radius = 0.0, 0.0, 0.4

x, y = np.meshgrid(x, y)
r = np.sqrt((x - x0)**2 + (y - y0)**2)

outside = r > radius

fig, ax = plt.subplots()
ax.set(xlabel='X', ylabel='Y', aspect=1.0)

ax.scatter(x[outside], y[outside])

plt.show()
另一方面,如果您使用像 imshow 这样需要 2D 输入的东西,您需要屏蔽里面的值(正如@JulienSpronck 提到的,尽管最好设置它们到 np.nan 或使用掩码数组而不是将它们设置为 0)或在图像上设置剪辑路径。
然而,对于散点图,您不需要二维输入。
nD 数组的 bool 索引将返回一维结果。例如:
In [9]: x = np.arange(100).reshape(10, 10)

In [10]: x
Out[10]:
array([[ 0,  1,  2,  3,  4,  5,  6,  7,  8,  9],
       [10, 11, 12, 13, 14, 15, 16, 17, 18, 19],
       [20, 21, 22, 23, 24, 25, 26, 27, 28, 29],
       [30, 31, 32, 33, 34, 35, 36, 37, 38, 39],
       [40, 41, 42, 43, 44, 45, 46, 47, 48, 49],
       [50, 51, 52, 53, 54, 55, 56, 57, 58, 59],
       [60, 61, 62, 63, 64, 65, 66, 67, 68, 69],
       [70, 71, 72, 73, 74, 75, 76, 77, 78, 79],
       [80, 81, 82, 83, 84, 85, 86, 87, 88, 89],
       [90, 91, 92, 93, 94, 95, 96, 97, 98, 99]])

In [11]: x[x > 75]
Out[11]:
array([76, 77, 78, 79, 80, 81, 82, 83, 84, 85, 86, 87, 88, 89, 90, 91, 92,
       93, 94, 95, 96, 97, 98, 99])
因为 scatter 只是绘制点,它不关心它们是如何连接的,我们可以很容易地使用 bool 索引的一维结果。
另一方面,如果您想绘制图像,则需要二维网格。在这种情况下,您需要屏蔽这些值:
In [12]: np.ma.masked_where(x <= 75, x)
Out[12]:
masked_array(data =
 [[-- -- -- -- -- -- -- -- -- --]
 [-- -- -- -- -- -- -- -- -- --]
 [-- -- -- -- -- -- -- -- -- --]
 [-- -- -- -- -- -- -- -- -- --]
 [-- -- -- -- -- -- -- -- -- --]
 [-- -- -- -- -- -- -- -- -- --]
 [-- -- -- -- -- -- -- -- -- --]
 [-- -- -- -- -- -- 76 77 78 79]
 [80 81 82 83 84 85 86 87 88 89]
 [90 91 92 93 94 95 96 97 98 99]])
注意这是如何维护输入的二维结构的。
附带说明一下,如果这是一个 float 组,您可以轻松地将值设置为 np.nan 而不是屏蔽它们。当使用 imshow 绘制时,两者的行为相同。在这种情况下,我使用了一个掩码数组,因为 x 是一个整数数组,不能包含 NaN。
关于python - 如何删除圆内的一组网格点?,我们在Stack Overflow上找到一个类似的问题: https://stackoverflow.com/questions/29330307/