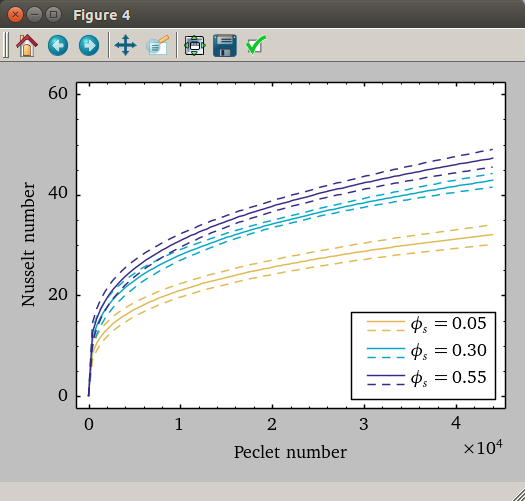
我有一个具有两种线条样式(实线和虚线)的绘图。我希望它们用于相同的图例条目。下面的代码生成典型的图例,有两个条目。
import matplotlib.pyplot as plt
import numpy as np

xy = np.linspace(0,10,10)

plt.figure()
plt.plot(xy,xy, c='k', label='solid')
plt.plot(xy,xy+1, c='k', ls='dashed', label='dashed')
plt.plot(xy,xy-1, c='k', ls='dashed')
plt.legend()

plt.show()
我想要的是类似这样的东西:

我试过与代理艺术家一起玩,但似乎无法获得两条线,彼此偏移以显示一个条目。
最佳答案
我基于 HandlerLineCollection 类创建了一个自定义图例处理程序。它计算出集合中有多少行并将它们垂直展开。
示例图片:
这是处理程序:
from matplotlib.legend_handler import HandlerLineCollection
from matplotlib.collections import LineCollection
from matplotlib.lines import Line2D


class HandlerDashedLines(HandlerLineCollection):
"""
Custom Handler for LineCollection instances.
"""
def create_artists(self, legend, orig_handle,
                   xdescent, ydescent, width, height, fontsize, trans):
    # figure out how many lines there are
    numlines = len(orig_handle.get_segments())
    xdata, xdata_marker = self.get_xdata(legend, xdescent, ydescent,
                                         width, height, fontsize)
    leglines = []
    # divide the vertical space where the lines will go
    # into equal parts based on the number of lines
    ydata = ((height) / (numlines + 1)) * np.ones(xdata.shape, float)
    # for each line, create the line at the proper location
    # and set the dash pattern
    for i in range(numlines):
        legline = Line2D(xdata, ydata * (numlines - i) - ydescent)
        self.update_prop(legline, orig_handle, legend)
        # set color, dash pattern, and linewidth to that
        # of the lines in linecollection
        try:
            color = orig_handle.get_colors()[i]
        except IndexError:
            color = orig_handle.get_colors()[0]
        try:
            dashes = orig_handle.get_dashes()[i]
        except IndexError:
            dashes = orig_handle.get_dashes()[0]
        try:
            lw = orig_handle.get_linewidths()[i]
        except IndexError:
            lw = orig_handle.get_linewidths()[0]
        if dashes[0] != None:
            legline.set_dashes(dashes[1])
        legline.set_color(color)
        legline.set_transform(trans)
        legline.set_linewidth(lw)
        leglines.append(legline)
    return leglines
下面是一个如何使用它的例子:
#make proxy artists
#make list of one line -- doesn't matter what the coordinates are
line = [[(0, 0)]]
#set up the line collections
lc = LineCollection(2 * line, linestyles = ['solid', 'dashed'], colors = ['black', 'black'])
lc2 = LineCollection(2 * line, linestyles = ['solid', 'dashed'], colors = ['blue', 'blue'])
lc3 = LineCollection(3 * line, linestyles = ['solid', 'dashed', 'solid'], colors = ['blue', 'red', 'green'])
#create the legend
plt.legend([lc, lc2, lc3], ['text', 'more text', 'extra line'], handler_map = {type(lc) : HandlerDashedLines()}, handlelength = 2.5)
关于python - 图例中的两种线型,我们在Stack Overflow上找到一个类似的问题: https://stackoverflow.com/questions/31544489/