我是一名地质学家,有一堆不同深度的钻孔。
我粗略地设置了子图的数量、宽度和高度,以根据钻孔的数量和这些钻孔中的样本数量而变化。
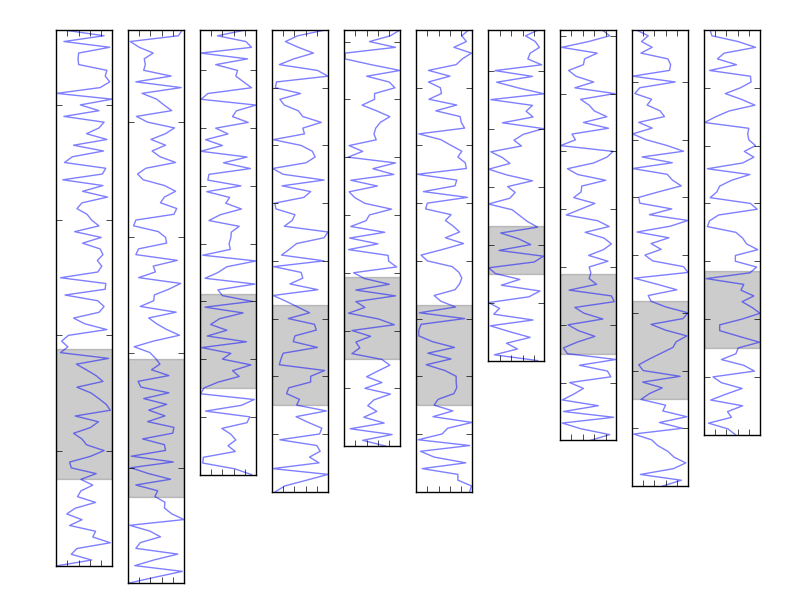
在每个钻孔中都有一个我想突出显示的区域,这是我用 axhspan 完成的。
我想做的是关联钻孔(子图),画一条线连接所有钻孔的所有分区区域的顶部和底部。
我尝试过使用 annotate,但进展不大。 我不太确定如何处理这个问题,不胜感激任何建议。
这是一些示例代码,以及它可能产生的结果的图片
import numpy as np
import matplotlib.pyplot as plt
from random import randint

fig = plt.figure()

Wells=np.arange(0,10,1) #number of wells to plot

for i in Wells:
    samp=randint(50,100) #number of samples in well

    dist=0.02     #space between plots
    left=0.05     #left border
    right=0.05    #right border
    base=0.05     #bottom border
    width=((1.0-(left+right))/len(Wells))     #width of subplot
    height=(1.0-base)/(100.0/samp)            #height of subplot

    #create subplots
    ax = fig.add_axes([left+(i*width)+dist, 1.0-(base+height), width-dist, height])    #left,bottom,width,height of subplot

    #random data
    x=np.random.random_integers(100,size=(samp))
    y=np.arange(0,len(x),1)

    #plot
    ax.plot(x,y,alpha=0.5)

    #zone area of plot
    zone=samp/2.5
    ax.axhspan(15, zone, color='k', alpha=0.2) #axis 'h' horizontal span

    #format
    ax.set_ylim(0,max(y))
    ax.set_xlim(0,max(x))
    ax.tick_params(axis='both',label1On=False,label2On=False)

plt.show()
 :
:
最佳答案
您可以使用 matplotlib.patches.ConnectionPatch 建立此连接。
在您的for 循环之前添加:
xys_bot = []
xys_top = []
在 for 循环的末尾:
for i in Wells:
    #
    #...
    #
    xys_bot.append( ((x.max() - x.min())/2., 15) )
    xys_top.append( ((x.max() - x.min())/2., zone) )
    if i > 0:
        # bottom line
        p = ConnectionPatch(xyA = xys_bot[i-1], xyB = xys_bot[i],
               coordsA='data', coordsB='data',
               axesA=fig.axes[i-1], axesB=ax,
               arrowstyle='-')
        ax.add_artist(p)
        # top line
        p = ConnectionPatch(xyA = xys_top[i-1], xyB = xys_top[i],
               coordsA='data', coordsB='data',
               axesA=fig.axes[i-1], axesB=ax,
               arrowstyle='-')
        ax.add_artist(p)

plt.draw()
plt.show()
关于python - 在 matplotlib 中的多个子图之间画一条线关联区域,我们在Stack Overflow上找到一个类似的问题: https://stackoverflow.com/questions/17378675/