我有一个二维数组 Z,它存储该元素位置的高度。除了使用方法 here其中我需要创建与 Z 大小相同的数组 X 和 Y,是否有更简单的方法来创建 3D 高度图?
3D 表面高度图类似于第一个表面图 here .
最佳答案
这里是matplotlib的代码
from mpl_toolkits.mplot3d import Axes3D
import matplotlib.pyplot as plt
import numpy as np
z = np.array([[x**2 + y**2 for x in range(20)] for y in range(20)])
x, y = np.meshgrid(range(z.shape[0]), range(z.shape[1]))
# show hight map in 3d
fig = plt.figure()
ax = fig.add_subplot(111, projection='3d')
ax.plot_surface(x, y, z)
plt.title('z as 3d height map')
plt.show()
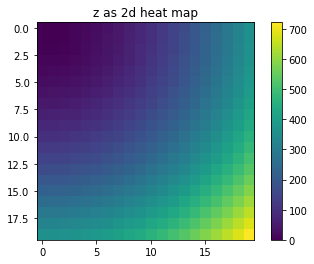
# show hight map in 2d
plt.figure()
plt.title('z as 2d heat map')
p = plt.imshow(z)
plt.colorbar(p)
plt.show()
这里是 z 的 3D 图:

这里是 z 的二维图:
关于python - 如何在 python 中创建 3D 高度图,我们在Stack Overflow上找到一个类似的问题: https://stackoverflow.com/questions/30706919/