这个问题困扰了我一段时间。我正在尝试处理大量 .fits 文件形式的数据(大约 11000x9000 像素)。我需要做的是为天空中的许多物体创建一个“放大”RA/Dec 坐标图(理想情况下使用 astropy.wcs),具有来自一个拟合文件的轮廓和灰度(或来自另一个的热图)。
我的问题是,每当我从图像中切片数据(到我感兴趣的区域)时,我就会失去与天空坐标的关联。这意味着切片图像不在正确的位置。
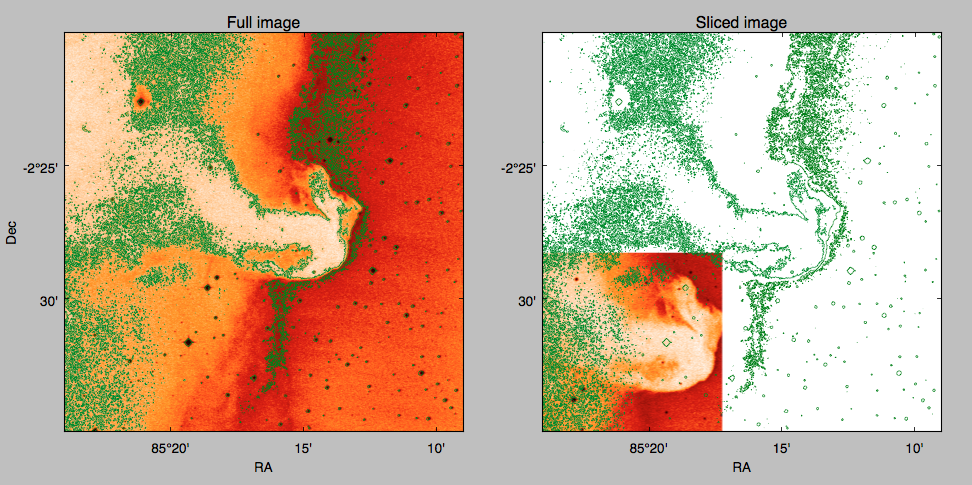
我改编了 the astropy docs 中的示例为您省去我数据的痛苦。 (注意:我希望轮廓比图像覆盖更多的区域,无论解决方案是什么都应该适用于这两种数据)
这是我遇到问题的代码:
from matplotlib import pyplot as plt
from astropy.io import fits
from astropy.wcs import WCS
from astropy.utils.data import download_file
import numpy as np

fits_file = 'http://data.astropy.org/tutorials/FITS-images/HorseHead.fits'
image_file = download_file(fits_file, cache=True)
hdu = fits.open(image_file)[0]
wmap = WCS(hdu.header)
data = hdu.data

fig = plt.figure()
ax1 = fig.add_subplot(121, projection=wmap)
ax2 = fig.add_subplot(122, projection=wmap)
# Scale input image
bottom, top = 0., 12000.
data = (((top - bottom) * (data - data.min())) / (data.max() - data.min())) + bottom


'''First plot'''
ax1.imshow(data, origin='lower', cmap='gist_heat_r')

# Now plot contours
xcont = np.arange(np.size(data, axis=1))
ycont = np.arange(np.size(data, axis=0))
colors = ['forestgreen','green', 'limegreen']
levels = [2000., 7000., 11800.]

ax1.contour(xcont, ycont, data, colors=colors, levels=levels, linewidths=0.5, smooth=16)
ax1.set_xlabel('RA')
ax1.set_ylabel('Dec')
ax1.set_title('Full image')

''' Second plot '''
datacut = data[250:650, 250:650]
ax2.imshow(datacut, origin='lower', cmap=cmap)
ax2.contour(xcont, ycont, data, colors=colors, levels=levels, linewidths=0.5, smooth=16)

ax2.set_xlabel('RA')
ax2.set_ylabel('')
ax2.set_title('Sliced image')
plt.show()
我尝试使用切片 block 的 WCS 坐标来解决此问题,但我不确定是否可以将其传递到任何地方!
pixcoords = wcs.wcs_pix2world(zip(*[range(250,650),range(250,650)]),1)
最佳答案
好消息是:您也可以简单地将 astropy.WCS 切片,这使您的任务相对简单:
...

wmapcut = wmap[250:650, 250:650] # sliced here
datacut = data[250:650, 250:650]
ax2 = fig.add_subplot(122, projection=wmapcut) # use sliced wcs as projection
ax2.imshow(datacut, origin='lower', cmap='gist_heat_r')
# contour has to be sliced as well
ax2.contour(np.arange(datacut.shape[0]), np.arange(datacut.shape[1]), datacut,
            colors=colors, levels=levels, linewidths=0.5, smooth=16)
...

如果您的文件具有不同的 WCS,您可能需要进行一些重新投影(参见示例 reproject)
关于python - 如何修剪 .fits 图像并保持世界坐标以便在 astropy Python 中绘图?,我们在Stack Overflow上找到一个类似的问题: https://stackoverflow.com/questions/38714293/