我正在 matplotlib 中绘制条形图。我想用小于或等于符号标记一个轴(< 下面有一条线)。
"<="看起来不那么专业。
有什么想法吗?
最佳答案
简答
您可以通过使用 unicode 字符串或使用 TeX 呈现字符串来实现此目的,具体取决于您的数学表达式的复杂程度。对于更高级的数学,TeX 更胜一筹。如果这个“小于或等于”符号是您代码中唯一的数学运算,使用 unicode 字符串最简单:
import matplotlib.pyplot as plt

...

plt.ylabel(u'α ≤ β') # In Python 3 you can leave out the `u`
要使用 TeX 呈现表达式,您必须将数学表达式包裹在字符串中的美元符号 ($) 中。当您这样做时,matplotlib 将使用它自己的 TeX 解析器 Mathtext 排版表达式。
import matplotlib.pyplot as plt

...

plt.ylabel(r'$\alpha\leq\beta$')
这里\leq代表“less than or equal”,给出符号≤ ,意味着 y 轴的标签将为 α ≤ β。
更长的答案
Unicode 字符串
Matplotlib 可以处理 unicode 字符串。在 Python 2.x 中,您必须指定字符串是 unicode,并在字符串前面加上 u,而在 Python 3.x 中,默认情况下所有字符串都是 unicode,这意味着您可以省略 你。
import matplotlib.pyplot as plt
import numpy as np

x = np.arange(10)
y = np.random.rand(10)

plt.plot(x,y)
plt.title('Unicode', fontsize=25)

# Set math expression as y-label
plt.ylabel(u'α ≤ β', fontsize=20)

plt.ylim(0,1)

plt.show()

使用 TeX 渲染
您可以将数学表达式包裹在美元符号 ($) 中,以确保 matplotlib 使用 TeX 呈现文本。这是使用真正的 LaTeX 或 matplotlib 自己的名为 Mathtext 的 TeX 解析器完成的,具体取决于您的 rc 设置以及您是否安装了本地 LaTeX。
如果您安装了本地 LaTeX,则可以在使用 pgf 后端时使用 XeLaTex、LuaLaTeX 或 pdfLaTeX 排版数学和文本。您还可以将 LaTeX 与 Agg、PS 和 PDF 后端一起使用。
我不会详细说明如何使用 XeLaTeX 或 LuaLaTeX,因为这远远超出了您的问题范围。如果您想了解更多关于它们的信息,请参阅引用资料中的链接。
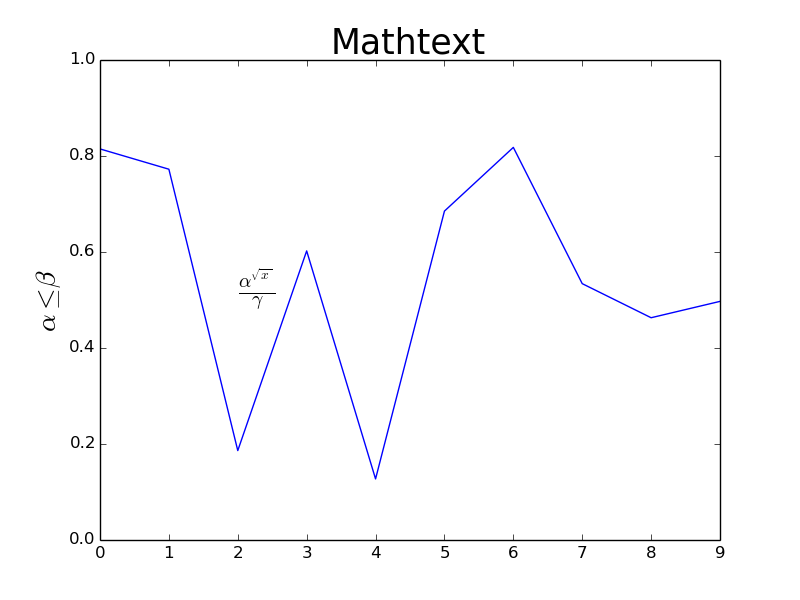
使用 Mathtext,matplotlib 自带的 TeX 解析器
要使用 matplotlib 自己的 TeX 解析器 Mathtext,只需将表达式包含在字符串中的美元符号内:
import matplotlib.pyplot as plt
import numpy as np

x = np.arange(10)
y = np.random.rand(10)

plt.plot(x,y)
plt.title('Mathtext', fontsize=25)

# Set math expression as y-label
plt.ylabel(r'$\alpha\leq\beta$', fontsize=20)

# The below code is only included to show differences between Mathtext
# and LaTeX

# Place math expression inside plot
# Mathtext does not handle `\displaystyle`
plt.text(2, 0.5, r'$\frac{\alpha^{\sqrt{x}}}{\gamma}$', fontsize=20)

plt.ylim(0,1)

plt.show()
使用真正的 LaTeX
要使用真正的 LaTeX 渲染,您必须在 rc 设置或代码中指定它。使用 LaTeX 而不是 Mathtext 的一个优点是您可以设置自己的序言(也在 rc 设置中),从而在 LaTeX 中加载外部包,从而为您提供扩展功能。同样,要使其正常运行,您需要安装本地 LaTeX。
# Import matplotlib before matplotlib.pyplot to set the rcParams
# in order to use LaTeX
import matplotlib as mpl
# Use true LaTeX and bigger font
mpl.rc('text', usetex=True)
# Include packages `amssymb` and `amsmath` in LaTeX preamble
# as they include extended math support (symbols, envisonments etc.)
mpl.rcParams['text.latex.preamble']=[r"\usepackage{amssymb}",
                                     r"\usepackage{amsmath}"]

import matplotlib.pyplot as plt
import numpy as np

x = np.arange(10)
y = np.random.rand(10)

plt.plot(x, y)
plt.title(r'\LaTeX', fontsize=25)

# Set math expression as y-label
plt.ylabel(r'$\alpha\leq\beta$', fontsize=20)

# The below code is only included to show differences between Mathtext
# and LaTeX

# Place math expression inside plot
# LaTeX handles `\displaystyle`, unlike Mathtext
plt.text(2, 0.5, r'$\displaystyle\frac{\alpha^{\sqrt{x}}}{\gamma}$', fontsize=20)

# Use extended capabilities of LaTeX to show symbols not
# available in Mathtext
plt.text(5, 0.5, r'$\Gamma\leqq\Theta$', fontsize=20)
plt.text(5, 0.7, r'$\displaystyle \frac{\partial f}{\partial x}$', fontsize=20)

plt.ylim(0, 1)

plt.show()
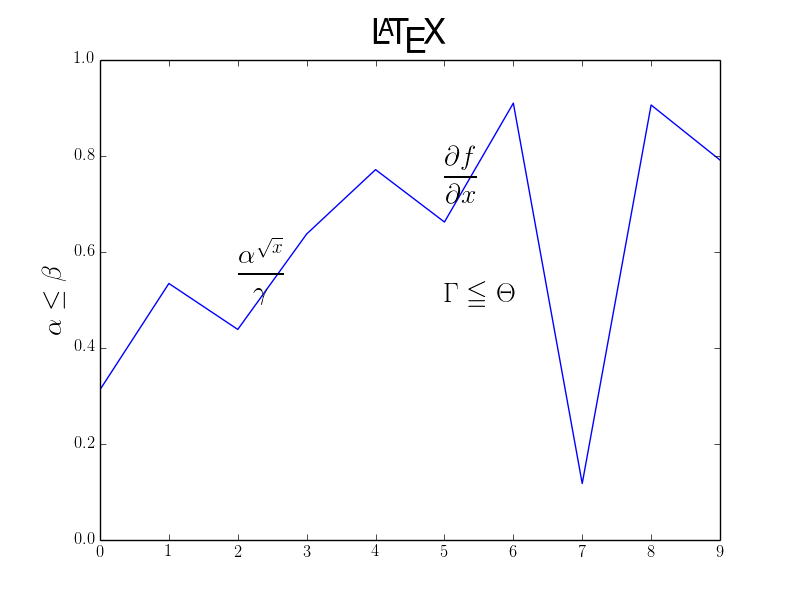
请注意如何使用 LaTeX 呈现所有文本(例如,刻度标签和标题),而不仅仅是使用真正的 LaTeX 时的数学。
引用资料:
关于Python (matplotlib) 小于或等于文本中的符号,我们在Stack Overflow上找到一个类似的问题: https://stackoverflow.com/questions/18428823/