我正在尝试使用散点图绘制大型数据集。 我想使用 matplotlib 用单像素标记绘制它。 好像已经解决了。
https://github.com/matplotlib/matplotlib/pull/695
但我找不到关于如何获得单个像素标记的提及。
我的简化数据集(data.csv)
Length,Time
78154393,139.324091
84016477,229.159305
84626159,219.727537
102021548,225.222662
106399706,221.022827
107945741,206.760239
109741689,200.153263
126270147,220.102802
207813132,181.67058
610704756,50.59529
623110004,50.533158
653383018,52.993885
659376270,53.536834
680682368,55.97628
717978082,59.043843
我的代码如下。
import pandas as pd
import os
import numpy
import matplotlib.pyplot as plt

inputfile='data.csv'
iplevel = pd.read_csv(inputfile)
base = os.path.splitext(inputfile)[0]

fig = plt.figure()
plt.yscale('log')
#plt.xscale('log')
plt.title(' My plot:  '+base)
plt.xlabel('x')
plt.ylabel('y')
plt.scatter(iplevel['Time'], iplevel['Length'],color='black',marker=',',lw=0,s=1)
fig.tight_layout()
fig.savefig(base+'_plot.png', dpi=fig.dpi)
您可以在下面看到这些点不是单个像素。
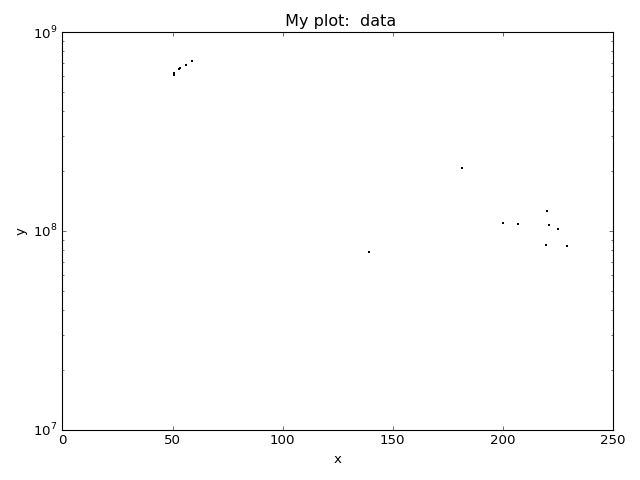
感谢任何帮助
最佳答案
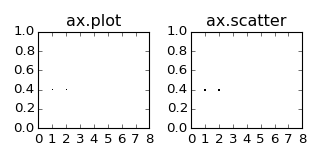
问题
我担心您引用的 matplotlib git 存储库中讨论的错误修复仅对 plt.plot() 有效,对 plt.scatter() 无效/p>
import matplotlib.pyplot as plt

fig = plt.figure(figsize=(4,2))
ax = fig.add_subplot(121)
ax2 = fig.add_subplot(122, sharex=ax, sharey=ax)
ax.plot([1, 2],[0.4,0.4],color='black',marker=',',lw=0, linestyle="")
ax.set_title("ax.plot")
ax2.scatter([1,2],[0.4,0.4],color='black',marker=',',lw=0, s=1)
ax2.set_title("ax.scatter")
ax.set_xlim(0,8)
ax.set_ylim(0,1)
fig.tight_layout()
print fig.dpi #prints 80 in my case
fig.savefig('plot.png', dpi=fig.dpi)
解决方案:设置标记大小
解决方案是使用通常的 "o" 或 "s" 标记,但将标记大小设置为正好一个像素。由于标记大小以点为单位给出,因此需要使用图形 dpi 来计算一个像素的大小(以点为单位)。这是 72./fig.dpi。
对于一个plot`,markersize直接为ax.plot(..., marker="o", ms=72./fig.dpi)对于
散点图,标记大小通过s参数给出,以方点为单位,ax.scatter(..., marker='o', s=(72./fig.dpi)**2)
完整示例:
import matplotlib.pyplot as plt

fig = plt.figure(figsize=(4,2))
ax = fig.add_subplot(121)
ax2 = fig.add_subplot(122, sharex=ax, sharey=ax)
ax.plot([1, 2],[0.4,0.4], marker='o',ms=72./fig.dpi, mew=0,
        color='black', linestyle="", lw=0)
ax.set_title("ax.plot")
ax2.scatter([1,2],[0.4,0.4],color='black', marker='o', lw=0, s=(72./fig.dpi)**2)
ax2.set_title("ax.scatter")
ax.set_xlim(0,8)
ax.set_ylim(0,1)
fig.tight_layout()
fig.savefig('plot.png', dpi=fig.dpi)

关于python - matplotlib 中带有单像素标记的散点图,我们在Stack Overflow上找到一个类似的问题: https://stackoverflow.com/questions/39753282/